Introduction
The Schedule tile allows you to view information related to current and upcoming maintenance windows.
Permissions
See Using RBAC for more information.
Create a Schedule Tile
To select your client, click the Client/Partner dropdown menu.
Note: You may either type your client’s name in the search bar or select your client from the list.From DASHBOARDS menu click Dashboard.
Create a new dashboard or select from an existing dashboard collection.
See Create Dashboards to learn about creating dashboards.
Click CREATE TILE or + from the toolbar.
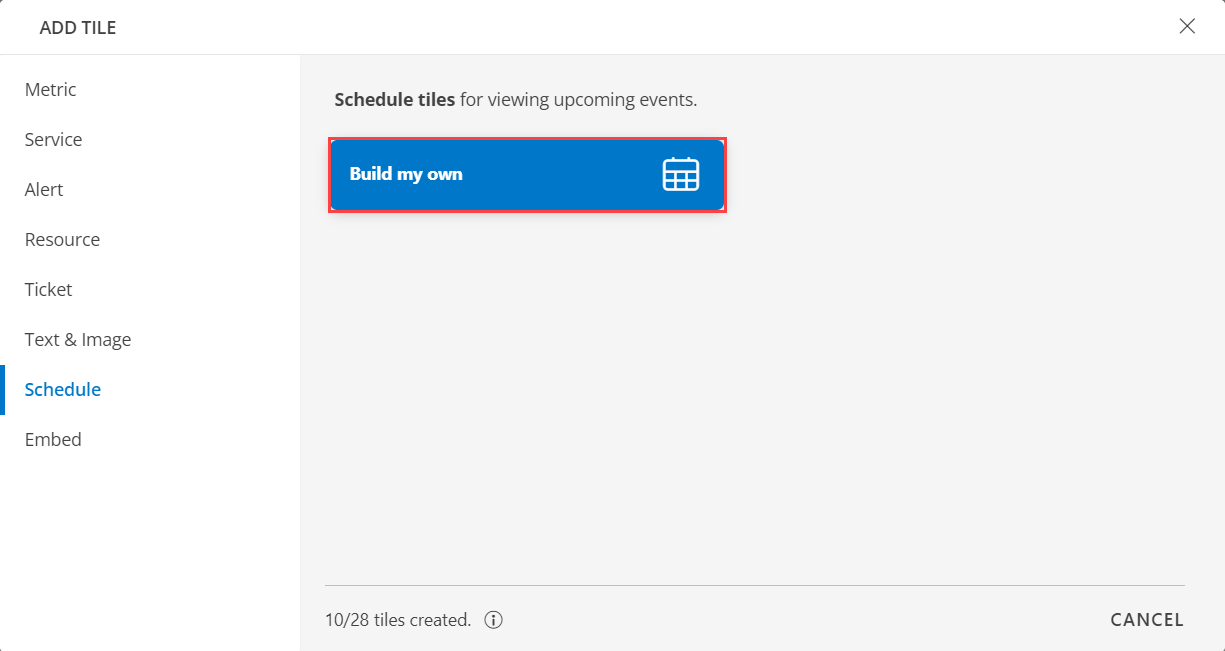
In the ADD TILE screen that appears, select Schedule.
The following screen is displayed:
Select one of the following:
| Tile Options | Functionality |
|---|---|
| Build my own | Schedule a tile to view current and upcoming events. |
Build My Own
Select the Build my own tab. This enables you to create a custom tile.
The ADD SCHEDULE TILE window is displayed.

The window displays maintenance details in card and tabular formats. You can see the details in card format, by default.
The following information is displayed:
Information Description Schedule maintenance name Name of the schedule maintenance.
Hover over the maintenance window name to view its details.Recurring schedule icon Displays recurring maintenance window schedule details (in both tabular and schedule visualizations). The icon displays both the maintenance schedule details and their descriptions.
The displayed details include:- Recurring schedule name.
- Timezone.
- Start and End date and time.
- Recurring schedule details.
Example:Occurs weekly on Monday, Wednesday and Friday from 5:00 pm to 11:00 PM, starting on April 10, 2025, to no end. - Recurring schedule description.

Status Active and scheduled. The active maintenance window(s) appear first (indicated by the ACTIVE label highlighted in orange) followed by the scheduled ones. Start and End date and time Displays maintenance window start date and time. Impacted resource(s) Resource(s) that are impacted for each maintenance activity - Shows the number of resources that are impacted due to the scheduled maintenance. - Click the resources impacted link to view the list of assigned resources.
- Click the group icon to view the list of assigned resource groups.
- Click on a maintenance window name to view its details.
Note:- You cannot modify active maintenance window details.
- You can only modify a maintenance window that is scheduled at a later date or time.
- You can easily navigate between dates using the arrows.
Tabular visualization:
The tile has tabular visualization option, enabling you to view the schedules in a tabular format.

To view the details in tabular format:
- Click the table icon. The schedule details are displayed as shown in the above image. All current and pending maintenance windows are displayed.
The following table describes the columns:
Column Name Description Name Schedule Maintenance name Scheduled Start date and time of the maintenance window. Ends End date and time of the maintenance window. In the Resource Groups dropdown, you may either Select All or view the list of schedule maintenance for a selected set of resource group(s).
Current and pending maintenance windows for the selected groups will be displayed.
Visualization
Visualization settings - Card format:
- Click the Visualization tab to customize the visualization further:

TILE
Label Name Description Background Color Select the background color.
Clear the checkbox to remove the background color.
Note: By default, the Background Color option is enabled.DISPLAY
Functionality Description Month Choose the color and size. Day Choose the color and size.
Visualization settings - Tabular format:
- Click the Visualization tab to customize the visualization further:

TILE
Label Name Description HEADER Enter the Header name. Select a color for the header and font size.
Select the alignment for the header:
Left or Center.Background Color Select the background color checkbox to enable it. Select the background color.
Note: By default, the Background Color option is disabled.DISPLAY
Functionality Description Columns Select the columns to be displayed in the tile. - Click x next to the column name to deselect it. The column will not appear in the tile.
- Click and drag column names to reorder them.
- Click CREATE.
The Schedule tile is created and displayed on the main dashboard screen.