Introduction
The MetricsQL is a PrometheusQL compatible query language to query metrics from OpsRamp. With MetricsQL, you can express queries using the same syntax as PromQL. This document describes the functionality, terminology, and also usage of MetricsQL with examples.
The MetricsQL collects and stores monitoring data, and displays the same data visually in the form of time series graphs.
Features
- Supports querying on multiple devices using multiple metrics in a single graph/widget.
- Enables visualization of various types of metrics. For example, resource metrics or any custom integration.
- Supports aggregation operators and functions that can be used to query and get the desired results.
- Provides dynamically populated drop-downs with metrics, tags, aggregates, and functions with the Basic Query feature. The user can choose from the list to build a query.
Metrics
Metrics provide an overall picture of the health and performance of your system.
Metrics are the basic values used to:
- Understand historical trends.
- Compare various factors.
- Identify patterns and anomalies.
- Find errors and problems.
For instance, you can quickly visualize the average memory usage of your servers, CPU utilization, or free virtual memory.
Once the problem is identified, you can troubleshoot and fix it.
Metrics help an organization save time, effort, money and improve performance.
Terminology
| Attribute/Name | Description | ||||||||||||
|---|---|---|---|---|---|---|---|---|---|---|---|---|---|
| Metric Name ( For example: system_memory_usage_usedspace ) | Allowed Regex for Metric names: uppercase and lowercase characters, numbers, special characters such as ":", "_", "-", "*", "[", "]" | ||||||||||||
| Labels |
Following are the accepted values for Labels: Metric data point | A metric data point is made up of: | Time series | Combinations of metric name, labels, and sets of data points collected over a period are called Time series. | Instant vector | A set of time series containing a single sample for each time series, all sharing the same timestamp is called an Instant vector. | Range Vector | A set of time series containing a range of data points over a time for each time series is called a Range Vector. | Time Range/Duration | Time durations are specified as a number, followed immediately by one of the following units: | Step Value | |
MetricsQL
MetricsQL provides the flexibility to query using metrics, functions, operators and labels. The results of the query can be shown in the form of graphs, viewed as tabular data, or consumed via API.
Visualization of metrics using queries in Dashboard 2.0:
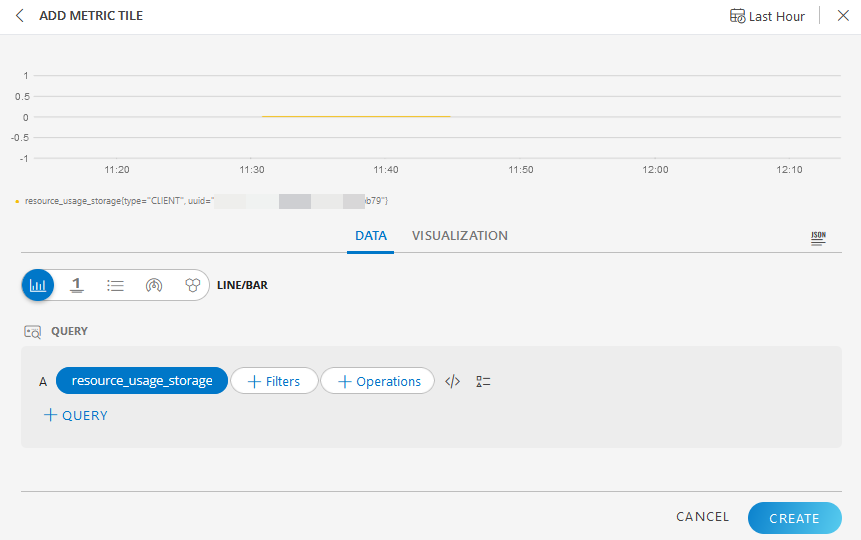
- Create a metric tile in Dashboard 2.0
- Specify the MetricsQL expression
Retrieve data using the MetricsQL API:
- Specify the MetricsQL expression and the duration of the timestamp in the API.
- Click here for API reference.
Metrics Page (Beta) shows all the metrics graphs related to a resource
(navigation: Infrastructure > Resources).- Contains options to render graphs for: 1H/2H/4H/8h/1 Week/1 Month/1 year/Month-to-Date/Year-to-Date/Custom Range duration.
- Up to 1 week duration: The graph shows raw samples based on default step value: 1min.
- Example: If the metrics are collected with a configured frequency of 5 min and default step value of 1 min(60 sec), the same value is rendered from T to T+4m (example 8:00 AM to 8:04 AM). This is the default behavior in MetricsQL. It will show the same value from 8:00 AM till 8:05 AM.
- Graphs are displayed with a uniform frequency of 1 min by default, irrespective of the configured frequency, to support multiple metrics in one graph.
- MetricsQL (PromQL) has a frequency, that is, resolution step (example: 1 min) independent of the underlying details of metrics configured frequency.
- This helps to query with multiple metrics and resources in one request and plot in the same graph to compare the performance across different parameters (metrics/resources).
- 1 week to 3 months: The graph shows 1 hour Average/Maximum/Minimum values based on selection.
- More than 3 months: The graph shows 1 day Average/Maximum/Minimum values based on selection.
- Up to 1 week duration: The graph shows raw samples based on default step value: 1min.
- Contains options to render graphs for: 1H/2H/4H/8h/1 Week/1 Month/1 year/Month-to-Date/Year-to-Date/Custom Range duration.
The following basic steps help you to write MetricsQL expressions that can be used either in Dashboard 2.0 or API:
Example 1: Querying with CPU metric for a resource:
- Type the metric name in the PromQL query box:
“system_cpu_usage_utilization” – This shows the CPU usage at the client level.
- Type the metric name in the PromQL query box:
Step value calculation
Default step value in the query is 60 sec.
Example: Consider sending samples every 10 min, you can view 10 samples. For 24 hours, it will be 24X60=1440 samples. For a month, this will be 1440X30=43200. The API response will have more data. Consider the recommended step size.
Step value limits the number of returned points per time-series based on step value resolution. Step is interval in terms of seconds. Metric engine time series data, by default, can give up to 11,000 data points only.
Example: If you are querying data for the last 10 days with step value as 60 sec, you will get the below exception:- Exceeded maximum resolution of 11,000 points per time series. Try decreasing the query resolution (?step=XX)
- Exceeded maximum resolution of 11,000 points per time series. Try decreasing the query resolution (?step=XX)
If the data collection stops, the metrics data will keep displaying the most recent sample collected for a duration of up to 15 minutes.
In a generalized scenario, considering a monitoring frequency of 5 minutes, if data collection stops at 7:00 AM, the stale data collected up to that point will continue to be displayed until 7:15 AM. After that, no new data will be shown for the next 5-minute interval.Sample calculation at the metric engine for 10 days duration based on the step value is as below:
- start = 1634629345
- end = 1635493345
- step = 60(60 sec)
- Formula ((end-start / step)>11000)
- (1635493345-1634629345)/60 = 14400, that is, result greater than 11000. This is more than the support limit.
- Formula ((end-start / step)>11000)
- Example calculations based on the above limitation up to 11000 data points for best practice.
- For 11000 points up to one week, use step value as 60 sec
- For 11000 points up to one year, use step value as 1hr (3600 sec)
Recommended step size, time interval and default sizing
| Time Interval | Step Size |
|---|---|
| up to 1 day | 60 sec |
| > 1 day and up to 1 month | 3600 sec |
| > 1 month and < 1 year | 86400 sec |
Note: If you do not provide step value, the above default values will be considered by default.
Example: Custom scenario to get 12 months metric data
- Create the step size as per requirement, say for each day/week with 90 sec interval step size. This should be within 16 MB data size and 11,000 data points.
- Get the metric for each day/week to complete the 12-month period.
- Collect metric data for each day with the set step-size.
Example: Split the entire duration into multiple durations. So, slice the 12 months data into 4 parts, that is, every 3 months.https://<server.com>/metricsql/api/v3/tenants/<tenantId>/metrics?query=synthetic_response_time%7Binstance%3D%7E%22MonitoringChannel%7CTest+old+binary%22%7D%26step%3D90&start=1630454400&end=1630540800
Max data size supported
- 16 MB per endpoint call
Max MetricsQL length
- 8K Characters
Limitations in MetricsQL query
Query response below 5 MB data is advised for faster response.
Example 1: Querying metrics with longer duration and shorter step size:
system_cpu_utilization{name=”host1”}[15m], Duration:May to Jul
Solution: Query with a shorter time period.Example 2: Query contains multiple interface details as instances.
network_interface_traffic_in{name=”switch1”}[15M],
Duration:Oct 1st to Oct 15thSolution: Filtering with instance names gives faster response. Response data size will decrease when you query with multiple labels.
network_interface_traffic_in{name="switch1",instance=~"eth0|eth1|if12"}[15M], Duration:Oct 1st to Oct 15thMax Response data using queries should not exceed the 16 MB limit.
Example:
system_cpu_utilization, Duration:1 hour
This will fetch cpu utilization for the entire client. A client has many resources and the CPU metric is applied on all of them. If you query for all the resources, the response data will be huge.Solution: Filtering with resource names, labels, instances, or any other filter.
Expect slow response time/browser loading time, if the query response is between
5MBand16MB.- Create Multiple dashboard metric tiles to avoid slow response time.
- Create multiple API queries with lesser duration time range and filtered with labels. That is, if you want to create the API query for a one-month time range, then you can slice the time period into 3 parts. So, in this case it will be 10 days per query. Similarly, if you want to fetch data for 10 devices, you can use two separate queries; one query for 5 devices and another query for 5 devices.
Maximum TimeSeries data up to 11000 data points only.
Exception: Data Limits exceeded message pops up when this limitation is breached.Step value and duration limits the number of returned data points.
See Step value recommendation
Data Retention Policy
- The maximum retention period of the metric data is 12 months
- Based on the TTL configuration, more than 12 months data will be deleted.
| Query Use Case for Time Series Data | PromQL Query | Data Type | ResultType | Description |
|---|---|---|---|---|
| On Metric Level(__name__) | system_cpu_utilization | Range Vector | Matrix | Querying data using Metric Name(__name__) label |
| On Metric +multiple label Combination | system_cpu_utilization{type="RESOURCE",uuid="4530d51c-3b32-4a91-ae2e-160f50f50d94"} | Range Vector | Matrix | Querying data using metric name , Resource Type and Resource Unique_id combination |
| On Resource Type and Resource Unique Id combination without Metric Name | {type="RESOURCE",uuid="4530d51c-3b32-4a91-ae2e-160f50f50d94"} | Range Vector | Matrix | Querying data with the Combination of Resource type and Unique Id without Metric Name. |
| Multiple label values selection using Regex | system_cpu_utilization{instance=~"CPU"} | Range Vector | Matrix | Querying data on Multiple instance values selection using Regex |
| Multiple Metric Name Selection using Regex | {__name__=~"system_cpu_utilization|system_ping_pl"} | Range Vector | Matrix | Querying data on Multiple Metric Names |
| Based on Text Match Regex | {__name__=~".*ping_.*"} | Range Vector | Matrix | Querying data on Regex Matching |
| Count By Instance based on Metric Name | count by (instance) (system_cpu_utilization) | Range Vector | Matrix | Querying data by instances |
| Predicts the data based on last samples | predict_linear(demo_disk_usage_bytes[4h], 3600) | Predicts a value in 1 hour, based on the last 4 hours |
For more details on the PromQL-based queries, click Querying Prometheus
Queries for Utilization Metrics
Following are some effective queries for utilization metrics:
Average Utilization: To compute the average utilization of a metric, you can use the
avg()andavg_over_time()functions. These functions are designed to calculate the average values of metrics over a specific period.Function Description Syntax/Example Modifiers/Parameters avg()The avg()function computes the average of a metric across all the time series.avg(cpu_usage_seconds_total)
This query calculates the average value of thecpu_usage_seconds_totalmetric across all instances.avg_over_time()The avg_over_time()function computes the average of the rates of an expression over a specified time duration.avg_time_duration
The time range over which to compute the average.avg_over_time(name_of_Metric[avg_time_duration:])
Example: The below query calculates the average CPU usage over the past 24 hours:avg_over_time(cpu_usage_seconds_total[1d:])You can use the offset modifier to shift the time range back to analyze historical data.
Example: To calculate the average filesystem size for the 24-hour period that ended 1 day ago:avg_over_time(node_filesystem_size_bytes[1d] offset 1d)offset 1d:Shifts the time range back by 1 day to calculate the average value from the previous day.
Filtering Data by Specific Metrics:
You can filter the data by specific metric labels like instance or group.
Example: To fetch data for a specific instance and filter by group name containing "Test":avg_over_time(node_filesystem_size_bytes{instance="instanceName", group=~".*,Test,.*"}[10m:]){instance="instanceName", group=~".*,Test,.*"}:Filters time series by instance and uses a regular expression to match any group containing "Test".[10m:]:Looks at data points from the last 10 minutes.
Minimum Utilization
Function Description min()To calculate the minimum utilization, use the min()function in place ofavg()oravg_over_time()..min_over_timeExample: To calculate the minimum CPU usage over the last day: min_over_time(cpu_usage_seconds_total[1d:])Maximum Utilization
Function Description max()To calculate the maximum utilization, use the max()function in place ofavg()oravg_over_time()..max_over_timeExample: To calculate the maximum CPU usage over the last day: max_over_time(cpu_usage_seconds_total[1d:])Top 10 or 20 resources based on metric data
Function Description topk()To get the top 10 or 20 resources based on metric data, use the topk()function.topk(Number_of_top_resources, Name_of_Metric)The avg() function computes the average of a metric across all the time.Example: To get the top 10 CPU usage metrics over a 5-minute period: topk(10, rate(cpu_usage_seconds_total[5m]))Top metrics without specifying metric names
Function Description topk()You can also fetch top metrics without explicitly specifying metric names by using stable data items like nameanduuid.topk(10, {name=~".+", uuid=~".+"})Example: In this query, nameanduuidare stable identifiers that remain constant across the time series, allowing you to rank metrics accordingly.
You can also add additional parameters likeinstance,group, etc., to further refine your query.Note: The topk() function may not return exactly k distinct entities as specified (e.g., top 5) because multiple time series can have identical values, resulting in ties. In such cases, topk() includes all time series with the top values, which may cause the result set to exceed the specified limit k.
Frequency Asked Questions (FAQs)
Why do I see gaps in Dashboard widgets?
Gaps in Dashboard widgets refer to instances where:
- Data is missing from the visualizations.
- Widgets are not displaying content as expected.
- Visual elements are not aligned properly within the dashboard.
For example, you might encounter these issues in various Dashboard widgets:

Below are the Common Scenarios leading to Gaps in Time Series Data:
- Changes in System-Level Variables
- Servers or systems being unavailable at times
- Changes in metric details, such as custom labels
Changes in System-Level Variables
- IP Address: If the IP address of a monitored system changes, data continuity can be disrupted, leading to gaps in the dashboard.
- Hostname: Changes in the system’s hostname can also affect data tracking, as the monitoring system may no longer correctly associate incoming data with the previous entries.
- Group Name: Alterations in group names or classifications can result in data being incorrectly categorized or lost.
- Operating System (OS) Changes: Upgrades or changes in the OS can cause temporary data collection issues, leading to gaps in the dashboard widgets.
Resolution: Ensure any changes to system variables are synchronized with the monitoring system configurations to avoid disruptions in data collection.
Servers or systems being unavailable at times
- Downtime or Maintenance: If a server or system is temporarily unavailable due to maintenance or downtime, the monitoring system will not receive data, creating gaps in the time series displayed in dashboard.
- Network Issues: Intermittent network problems can also lead to periods where no data is collected or transmitted, resulting in gaps.
Resolution: Ensure that planned maintenance is communicated and that systems are correctly brought back online. Monitor network stability to minimize the impact of intermittent connectivity issues.
Changes in Metric Details
- Custom Labels: If there is a change in the custom labels associated with metrics (e.g., renaming or adding new labels), this can create gaps as the system may treat the new labels as separate data points.
- Metric Definition Updates: Updating or modifying the metric definitions can cause data to be categorized differently, leading to apparent gaps in the dashboard.
Resolution: Carefully manage and document any changes to metric labels or definitions. Ensure the monitoring system is updated to recognize and process these changes without disrupting the data flow.
Conclusion: Gaps in Dashboard widgets are often caused by changes in system-level variables, periods of system unavailability, or updates to metric details. By understanding and addressing these common scenarios, you can reduce or eliminate gaps, ensuring that your dashboards provide a complete and accurate view of your data.
For persistent issues, consider revisiting the configurations and settings in your Monitoring and Dashboard systems, or engage with the relevant support teams for further assistance.
Why do I see duplicate labels in the graph?
When working with graphs in Dashboards, you might notice Duplicate Labels. This means that the same label appears more than once in the graph, which can be confusing.
When you use PromQL query to filter your metrics and select a specific Legend, the graph might show duplicate labels. This occurs because while the selected Legend remains constant, other parts of data, like labels, might change, leading to multiple instances of the same label.
For example, if you select IP address as Legend, you might see the same label appearing more than once in the graph.

Related Topics
×Previous and Next Navigation