G2 - Agentless IBM AIX Basic Performance Monitoring - RSE - v2
Description
Monitors the basic performance metrics of IBM AIX servers like uptime, cpu, memory, disk utilizations. In version 2 of the template, we corrected a bug at the monitoring level that was present in version 1. This template requires Windows Gateway version 16.0.0 or later.
Prerequisites
SSH Credentials need to be assigned on end device. This template requires Windows Gateway version 16.0.0 or later
Supported Metric
| Monitor Name | Metric Name | Metric Display Name | Unit | Description |
|---|---|---|---|---|
| G2 - Agentless IBM AIX Basic Performance Monitor - v2 | ibm_aix_disk_utilization | ibm_aix_disk_utilization | Percentage | Monitors the disks utilization of IBM AIX servers. |
| ibm_aix_cpu_utilization | IBM AIX CPU Utilization | Percentage | Monitors the CPU utilization of IBM AIX servers. | |
| ibm_aix_swap_memory_utilization | IBM AIX Swap Memory Utilization | Percentage | Monitors the Swap Memory utilization of IBM AIX servers. | |
| ibm_aix_real_memory_utilization | IBM AIX Real Memory Utilization | Percentage | Monitors the Real Memory utilization of IBM AIX servers. | |
| ibm_aix_real_memory_used | IBM AIX Real Memory Used | MegaBytes | Monitors the amount of used real memory on IBM AIX servers, in megabytes (MB). | |
| ibm_aix_real_memory_total | IBM AIX Real Memory Total | MegaBytes | Monitors the amount of total real memory on IBM AIX servers, in megabytes (MB). | |
| ibm_aix_real_memory_free | IBM AIX Real Memory Free | MegaBytes | Monitors the amount of free real memory on IBM AIX servers, in megabytes (MB). | |
| ibm_aix_uptime | IBM AIX Uptime | Minutes | Monitors the uptime of IBM AIX server |
G2 - IBM Storwize Storage Array Cluster Template
Description
Monitor the cluster status and capacity. This template is applicable for storage array.
Prerequisites
No prerequisite
Supported Metric
| Monitor Name | Metric Name | Metric Display Name | Unit | Description |
|---|---|---|---|---|
| G2 - IBM Storwize Storage Array Cluster Monitor | ibm.storwize.cluster.status | IBM Storwize Cluster Status | NULL | Status of the Cluster |
| ibm.storwize.cluster.allocatedcapacity | IBM Storwize Cluster Allocated Capacity | GB | The total capacity of all StorageVolumes in the cluster. | |
| ibm.storwize.cluster.availablecapacity | IBM Storwize Cluster Available Capacity | GB | The currently available space in the cluster. This is approximate. | |
| ibm.storwize.cluster.backendstoragecapacity | IBM Storwize Cluster Backend Storage Capacity | GB | The total capacity of all backend storage connected to the cluster. | |
| ibm.storwize.cluster.utilization | IBM Storwize Cluster Utilization | % | Cluster Utilization |
G2 - IBM Storwize Storage Array Disk Template
Description
Monitor the disk component status and performance. This template is applicable for storage array.
Prerequisites
No prerequisite
Supported Metric
| Monitor Name | Metric Name | Metric Display Name | Unit | Description | |||||||||||||||||||||||||||||||||||||||||||||||||||||||||||||||||
|---|---|---|---|---|---|---|---|---|---|---|---|---|---|---|---|---|---|---|---|---|---|---|---|---|---|---|---|---|---|---|---|---|---|---|---|---|---|---|---|---|---|---|---|---|---|---|---|---|---|---|---|---|---|---|---|---|---|---|---|---|---|---|---|---|---|---|---|---|---|
| G2 - IBM Storwize Storage Array Disk Monitor | ibm.storwize.disk.kbytesread | IBM Storwize Disk KBytes Read | KB | Total bytes read from the disk | |||||||||||||||||||||||||||||||||||||||||||||||||||||||||||||||||
| ibm.storwize.disk.kbytestransferred | IBM Storwize Disk KBytes Transferred | KB | Total bytes trasfered from the disk | ||||||||||||||||||||||||||||||||||||||||||||||||||||||||||||||||||
| ibm.storwize.disk.kbyteswritten | IBM Storwize Disk KBytes Written | KB | Total bytes written to the disk | ||||||||||||||||||||||||||||||||||||||||||||||||||||||||||||||||||
| ibm.storwize.disk.readios | IBM Storwize Disk Read IOs | psec | The cumulative count of all reads. | ||||||||||||||||||||||||||||||||||||||||||||||||||||||||||||||||||
| ibm.storwize.disk.totalios | IBM Storwize Disk Total IOs | psec | The cumulative count of all read and writes. | ||||||||||||||||||||||||||||||||||||||||||||||||||||||||||||||||||
| ibm.storwize.disk.writeios | IBM Storwize Disk Write IOs | psec | The cumulative count of all writes. | ||||||||||||||||||||||||||||||||||||||||||||||||||||||||||||||||||
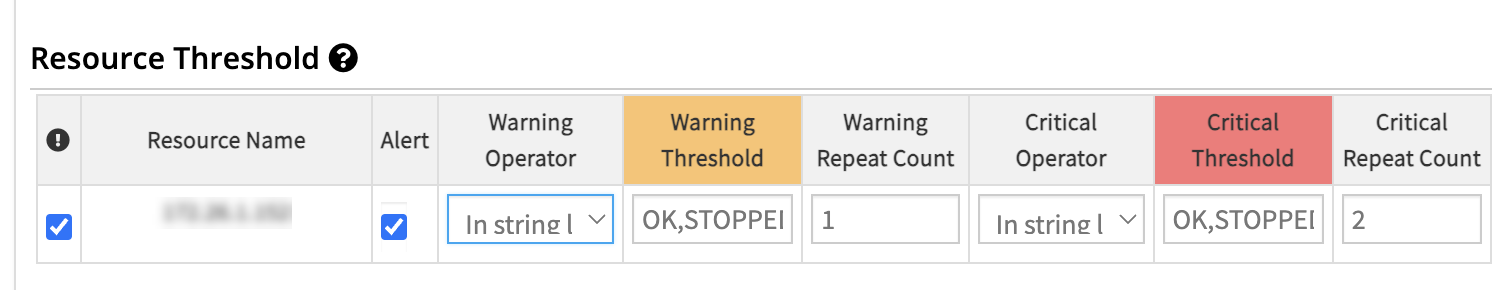
| ibm.storwize.disk.status | IBM Storwize Disk Status | NULL | State of the disk. Note: SMI-S Operational statuses codes and thresholds. The following configuration is for ibm.storwize.disk.status metric.
THRESHOLDS configurations: Example: Use In string list operator,and use above comma separated values like below: For Critical: For Warning: Use In string list operator,and comma separated values like below:
|
G2 - IBM Storwize Storage Array Ethernet Template
Description
Monitor the ethernet port status and speed. This monitor is applicable for storage array.
Prerequisites
No prerequisite
Supported Metric
| Monitor Name | Metric Name | Metric Display Name | Unit | Description |
|---|---|---|---|---|
| G2 - IBM Storwize Storage Array Ethernet Monitor | ibm.storwize.ethernetport.speed | IBM Storwize Ethernet Port Speed | bps | An estimate of the current bandwidth in Bits per Second. For ports that vary in bandwidth or for those where no accurate estimation can be made,this property should contain the nominal bandwidth. |
| ibm.storwize.ethernetport.status | IBM Storwize Ethernet Port Status | NULL | Status of the Ethernet port |
G2 - IBM Storwize Storage Lun Template
Description
Monitor the storage lun status and performance. This monitor is applicable for storage lun.
Prerequisites
No prerequisite
Supported Metric
| Monitor Name | Metric Name | Metric Display Name | Unit | Description |
|---|---|---|---|---|
| G2 - IBM Storwize Storage Lun Monitor | ibm.storwize.lun.kbytesread | IBM Storwize Lun KBytes Read | KB | Total bytes read from the lun |
| ibm.storwize.lun.kbytestransferred | IBM Storwize Lun KBytes Transferred | KB | Total bytes trasfered from the lun | |
| ibm.storwize.lun.kbyteswritten | IBM Storwize Lun KBytes Written | KB | Total bytes written to the lun | |
| ibm.storwize.lun.readios | IBM Storwize Lun Read IOs | psec | The cumulative count of all reads. | |
| ibm.storwize.lun.totalios | IBM Storwize Lun Total IOs | psec | The cumulative count of all read and writes. | |
| ibm.storwize.lun.writeios | IBM Storwize Lun Write IOs | psec | The cumulative count of all writes. | |
| ibm.storwize.lun.status | IBM Storwize Lun Status | NULL | Status of the disk |
G2 - IBM Storwize Storage Node Template
Description
Monitor the storage cluster node status and performance. This monitor is applicable for storage cluster node.
Prerequisites
No prerequisite
Supported Metric
| Monitor Name | Metric Name | Metric Display Name | Unit | Description |
|---|---|---|---|---|
| G2 - IBM Storwize Storage Node Monitor | ibm.storwize.node.readhitios | IBM Storwize Node Read Hit IOs | psec | The cumulative count of all read cache hits (reads from cache),which represents the number of track reads received from components above that have been treated by cache as a total hit on prestage or non-prestage data. |
| ibm.storwize.node.readios | IBM Storwize Node Read IOs | psec | The cumulative count of all reads. | |
| ibm.storwize.node.totalios | IBM Storwize Node Total IOs | psec | The cumulative count of all read and writes. | |
| ibm.storwize.node.writehitios | IBM Storwize Node Write Hit IOs | psec | The cumulative count of write cache hits (writes that went directly to cache without blocking),which represents the number of track writes received from components above and processed in fast write mode. | |
| ibm.storwize.node.writeios | IBM Storwize Node Write IOs | psec | The cumulative count of all writes. | |
| ibm.storwize.node.status | IBM Storwize Node Status | NULL | Status of the node |
G2 - IBM Storwize Storage Pool Template
Description
Monitor the storage pool status and capacity. This monitor is applicable for storage pool.
Prerequisites
No prerequisite
Supported Metric
| Monitor Name | Metric Name | Metric Display Name | Unit | Description |
|---|---|---|---|---|
| G2 - IBM Storwize Storage Pool Monitor | ibm.storwize.storagepool.status | IBM Storwize Storage Pool Status | NULL | State of the Storage pool |
| ibm.storwize.storagepool.availablesize | IBM Storwize Storage Pool Available Size | GB | Storage pool available size | |
| ibm.storwize.storagepool.utilization | IBM Storwize Storage Pool Utilization | % | Storage pool Utilization |
G2 - IBM Storwize Storage Volume Template
Description
Monitor the storage volume status and performance. This monitor is applicable for storage volume.
Prerequisites
No prerequisite
Supported Metric
| Monitor Name | Metric Name | Metric Display Name | Unit | Description |
|---|---|---|---|---|
| G2 - IBM Storwize Storage Volume Monitor | ibm.storwize.volume.kbytesread | IBM Storwize Volume KBytes Read | KB | Total bytes read from the volume |
| ibm.storwize.volume.kbytestransferred | IBM Storwize Volume KBytes Transferred | KB | Total bytes trasfered from the volume | |
| ibm.storwize.volume.kbyteswritten | IBM Storwize Volume KBytes Written | KB | Total bytes written to the volume | |
| ibm.storwize.volume.readhitios | IBM Storwize Volume Read Hit IOs | psec | The cumulative count of all read cache hits (reads from cache),which represents the number of track reads received from components above that have been treated by cache as a total hit on prestage or non-prestage data. | |
| ibm.storwize.volume.readios | IBM Storwize Volume Read IOs | psec | The cumulative count of all reads. | |
| ibm.storwize.volume.totalios | IBM Storwize Volume Total IOs | psec | The cumulative count of all read and writes. | |
| ibm.storwize.volume.writehitios | IBM Storwize Volume Write Hit IOs | psec | The cumulative count of write cache hits (writes that went directly to cache without blocking),which represents the number of track writes received from components above and processed in fast write mode. | |
| ibm.storwize.volume.writeios | IBM Storwize Volume Write IOs | psec | The cumulative count of all writes. | |
| ibm.storwize.volume.status | IBM Storwize Volume Status | NULL | Status of the volume. |
IBM AIX
Description
Applicable on IBM AIX devices. Monitors the CPU Utilization,file system usage,file system inodes utilization,volume group status,physical volume status,physical and logical volume usage and page space usage.
Prerequisites
No prerequisite
Supported Metric
| Monitor Name | Metric Name | Metric Display Name | Unit | Description |
|---|---|---|---|---|
| AIX CPU Utilization | aix.aggregate.cpu.utilization | Aggregate CPU Utilization | % | Provides CPU utilization. It is an aggregate view for utilization of multiple CPUs. aixSeCPUUtilization equals the sum of each CPU kernel time percentage and user time percentage divided by the number of CPUs.[OID: 1.3.6.1.4.1.2.6.191.1.2.1.0] |
| AIX File System | aix.file.system.inodes.utilization | AIX File System Inodes Utilization | % | Monitors the file system inode utilization. An inode is a data structure in UNIX operating systems that contains important information pertaining to files within a file system. When a file system is created in UNIX a set amount of inodes is created as well. Every time you create a file in the file system an inode is allocated to the file. Using the df command you can look at all mounted file systems or specific file systems. If for some reason a file system did reach 100 percent of its inodes used you wont be able to create additional files devices directories and so on in the file system. One solution is to add more space to the file system through the smitty chfs command. Other solution is to create smaller inode extents.[OID: 1.3.6.1.4.1.2.6.191.6.2.1.2,1.3.6.1.4.1.2.6.191.6.2.1.3,,1.3.6.1.4.1.2.6.191.6.2.1.7,1.3.6.1.4.1.2.6.191.6.2.1.8] |
| aix.file.system.utilization | AIX File System Utilization | % | The space usage on each of the file system.[OID: 1.3.6.1.4.1.2.6.191.6.2.1.2,1.3.6.1.4.1.2.6.191.6.2.1.3,1.3.6.1.4.1.2.6.191.6.2.1.5,1.3.6.1.4.1.2.6.191.6.2.1.6] | |
| AIX Paging Space Utilization | aix.paging.space.utilization | AIX Paging Space Utilization | % | This monitor is useful to determine how much paging is in use. If the amount of paging space is less than the amount of real memory in the system its possible the system will run out of paging space before real memory [OID: 1.3.6.1.4.1.2.6.191.2.4.2.1.1,1.3.6.1.4.1.2.6.191.2.4.2.1.5] |
| AIX Physical Volume Utilization | aix.physical.volume.utilization | AIX Physical Volume Utilization | % | Disk that is being managed by LVM . It monitors the total physical volume utilization.[OID: 1.3.6.1.4.1.2.6.191.2.3.1.1.1,1.3.6.1.4.1.2.6.191.2.3.1.1.2,1.3.6.1.4.1.2.6.191.2.3.1.1.4,1.3.6.1.4.1.2.6.191.2.3.1.1.5,1.3.6.1.4.1.2.6.191.2.1.2.1.6] |
| aix.physical.volume.status | AIX Physical Volume Status | State of the physical volume. If the volume group that contains the physical volume is varied on with the varyonvg command,the state is active,missing,or removed . If the physical volume is varied off with the varyoffvg command,the state is varied off.[OID: 1.3.6.1.4.1.2.6.191.2.3.1.1.1,1.3.6.1.4.1.2.6.191.2.3.1.1.3] | ||
| AIX Volume Group Utilization | aix.volume.group.utilization | AIX Volume Group Utilization | % | A volume group is a logical collection of disks" and is the basic building block of logical storage in AIX. A volume group (VG) can span multiple disks whether internal or external disks. Volume Group is at the highest level in LVM hierarchy. Hard disks are used as Physical Volumes in Logical Volume Manager (LVM). Then Physical partitions are mapped to Logical Partitions. Logical Partitions are combined to Logical Volumes. These Logical Volumes comprise the Volume Group.[OID: 1.3.6.1.4.1.2.6.191.2.3.1.1.1,1.3.6.1.4.1.2.6.191.2.3.1.1.4,1.3.6.1.4.1.2.6.191.2.3.1.1.5] |
| aix.volume.group.status | AIX Volume Group Status | State of the volume group. If the volume group is activated with the varyonvg command,the state is either active/complete (indicating all physical volumes are active) or active/partial (indicating some physical volumes are not active). If the volume group is not activated with the varyonvg command,the state is inactive.[OID: 1.3.6.1.4.1.2.6.191.2.1.2.1.3] |
IBM DataPower Gateway - Hardware
Description
Template to monitor Temperature Sensors Value,Environmental Fan Sensors Speed,Other Sensors Value,Other Sensors Reading Status,Voltage Sensors Value,Current Sensors Value. sysObjectID : 1.3.6.1.4.1.14685.1.8
Prerequisites
The device should have support for DATAPOWER-STATUS-MIB.
Supported Metric
| Monitor Name | Metric Name | Metric Display Name | Unit | Description |
|---|---|---|---|---|
| IBM DataPower Gateway - Current | ibm.data.power.gw.current.sensors.value | Current Sensors Value | mA | It monitors the most recent reading of the current sensor in milliamperes.[DATAPOWER-STATUS-MIB::dpStatusCurrentSensorsValue:1.3.6.1.4.1.14685.3.1.261.1.2] |
| IBM DataPower Gateway - Environmental Fan | ibm.data.power.gw.environmental.fan.sensors.speed | Environmental Fan Sensors Speed | rpm | It monitors the speed of the fan in revolutions per minute (RPM). Map component ID in graph/alert with below enum values 1: cpu-1,2: cpu-2,3: chassis-1,4: chassis-2,5: chassis-3,6: chassis-4,7: chassis-5,8: chassis-6,9: chassis-7,10: chassis-8,11: fan-tray-1-fan-1,12: fan-tray-1-fan-2,13: fan-tray-1-fan-3,14: fan-tray-1-fan-4,15: fan-tray-2-fan-1,16: fan-tray-2-fan-2,17: fan-tray-2-fan-3,18: fan-tray-2-fan-4,19: fan-tray-3-fan-1,20: fan-tray-3-fan-2,21: fan-tray-3-fan-3,22: fan-tray-3-fan-4,23: hard-disk-tray-fan-1,24: hard-disk-tray-fan-2,25: fan-1a,26: fan-1b,27: fan-2a,28: fan-2b,29: fan-3a,30: fan-3b,31: fan-4a,32: fan-4b,33: fan-1,34: fan-2,35: fan-3[DATAPOWER-STATUS-MIB::dpStatusEnvironmentalFanSensorsFanSpeed:1.3.6.1.4.1.14685.3.1.97.1.2]. |
| IBM DataPower Gateway - Other Sensors | ibm.data.power.gw.other.sensors.value | Other Sensors Value | It monitors the value of the sensors.[DATAPOWER-STATUS-MIB::dpStatusOtherSensorsValue:1.3.6.1.4.1.14685.3.1.142.1.2] | |
| ibm.data.power.gw.other.sensors.reading.status | Other Sensors Reading Status | It monitors the Other Sensors Reading Status.Possible values are 1: lowerNonRecoverable,2: lowerCritical,3: lowerNonCritical,4: ok,5: upperNonCritical,6: upperCritical,7: upperNonRecoverable,8: failure,9: noReading,10: invalid.[DATAPOWER-STATUS-MIB::dpStatusOtherSensorsReadingStatus:1.3.6.1.4.1.14685.3.1.142.1.3]. | ||
| IBM DataPower Gateway - Temperature | ibm.data.power.gw.temperature.sensors.value | Temperature Sensors Value | Celsius | It monitors the most recent reading of the temperature sensor in degree Celsius.[DATAPOWER-STATUS-MIB::dpStatusTemperatureSensorsValue:1.3.6.1.4.1.14685.3.1.141.1.2]. |
| IBM DataPower Gateway - Voltage | ibm.data.power.gw.voltage.sensors.value | Voltage Sensors Value | mV | It monitors the most recent reading of the voltage sensor in millivolts.[DATAPOWER-STATUS-MIB::dpStatusVoltageSensorsValue:1.3.6.1.4.1.14685.3.1.140.1.2]. |
IBM DataPower Gateway - Performance
Description
Template to IBM DataPower Gateway performance parameters like memory utilization,memory used,free memory,cpu utilization,system uptime,system usage load,File System Encrypted Utilization,File System Temporary Utilization,File System Internal Utilization,Domain Interface State,CPU Utilization 1Min,CPU Utilization 1Hour.sysObjectID : 1.3.6.1.4.1.14685.1.8
Prerequisites
The device should have support for DATAPOWER-STATUS-MIB.
Supported Metric
| Monitor Name | Metric Name | Metric Display Name | Unit | Description |
|---|---|---|---|---|
| IBM DataPower Gateway - Domain Interface State | ibm.data.power.gw.domain.interface.state | Domain Interface State | It monitors the state of the networking interfaces of the appliance which affects all domains.Possible values are ok(1),linkErrors(2),vlanErrors(3),aggErrors(4),linkVlanErrors(5),linkAggErrors(6),vlanAggErrors(7),allErrors(8) .[DATAPOWER-STATUS-MIB::dpStatusDomainStatusInterfaceState:1.3.6.1.4.1.14685.3.1.31.1.9]. | |
| IBM DataPower Gateway - FIle System | ibm.data.power.gw.file.sys.encrypted.util | File System Encrypted Utilization (%) | % | It monitors the file system encrypted utilization.[DATAPOWER-STATUS-MIB::dpStatusFilesystemStatusFreeEncrypted:1.3.6.1.4.1.14685.3.1.29.1,dpStatusFilesystemStatusTotalEncrypted:1.3.6.1.4.1.14685.3.1.29.2]. |
| ibm.data.power.gw.file.sys.temporary.util | File System Temporary Utilization (%) | % | It monitors the file system temporary utilization.[DATAPOWER-STATUS-MIB::dpStatusFilesystemStatusFreeTemporary:1.3.6.1.4.1.14685.3.1.29.5,dpStatusFilesystemStatusTotalTemporary:1.3.6.1.4.1.14685.3.1.29.6]. | |
| ibm.data.power.gw.file.sys.internal.util | File System Internal Utilization | % | It monitors the file system internal utilization.[DATAPOWER-STATUS-MIB::dpStatusFilesystemStatusFreeInternal:1.3.6.1.4.1.14685.3.1.29.7,dpStatusFilesystemStatusTotalInternal:1.3.6.1.4.1.14685.3.1.29.8]. | |
| IBM DataPower Gateway - Performance | ibm.data.power.gw.memory.utilization | Memory Utilization(%) | % | It monitors the instantaneous memory usage as a percentage of the total memory.[DATAPOWER-STATUS-MIB::dpStatusMemoryStatusUsage:1.3.6.1.4.1.14685.3.1.5.1] |
| ibm.data.power.gw.memory.used | Memory Used (in MB) | MB | It monitors the amount of memory that is currently in use. The used memory equals the amount of total memory minus the amount of free memory.[DATAPOWER-STATUS-MIB::dpStatusMemoryStatusUsedMemory:1.3.6.1.4.1.14685.3.1.5.3]. | |
| ibm.data.power.gw.memory.free | Free Memory (in MB) | Mb | It monitors the amount of memory that is currently not in use and is therefore available.[DATAPOWER-STATUS-MIB::dpStatusMemoryStatusFreeMemory:1.3.6.1.4.1.14685.3.1.5.4]. | |
| ibm.data.power.gw.cpu.utilization | CPU Utilization (%) | % | It monitors the average CPU usage over the the previous 10 minutes.[DATAPOWER-STATUS-MIB::dpStatusCPUUsagetenMinutes:1.3.6.1.4.1.14685.3.1.14.3] | |
| ibm.data.power.gw.system.usage.load | System Usage Load (%) | % | It monitors the percentage of total load on the device during the measurement interval.[DATAPOWER-STATUS-MIB::dpStatusSystemUsageLoad:1.3.6.1.4.1.14685.3.1.52.2] | |
| ibm.data.power.gw.cpu.utilization.1min | CPU Utilization 1Min | % | It monitors the average CPU usage over the previous 1minute.[DATAPOWER-STATUS-MIB::dpStatusCPUUsageoneMinute:1.3.6.1.4.1.14685.3.1.14.2]. | |
| ibm.data.power.gw.cpu.utilization.1hr | CPU Utilization 1Hour | % | It monitors the average CPU usage over the the previous hour.[DATAPOWER-STATUS-MIB::dpStatusCPUUsageoneHour:1.3.6.1.4.1.14685.3.1.14.4]. | |
| ibm.data.power.gw.system.uptime | System Uptime | s | It monitors the total amount of time the appliance has been up since the last reload or reboot.[DATAPOWER-STATUS-MIB::dpStatusDateTimeStatus2uptime3:1.3.6.1.4.1.14685.3.1.353.4.0]. |
IBM Hardware - G2
Description
Monitors Adaptec Universal Storage (AUS) parameters such as array status,installed memory,battery status,controller status and controller overall status,S.M.A.R.T. status and device status. Validated on the IBM eserver xSeries 346 -[884015U]-Object Id:1.3.6.1.4.1.311.1.1.3.1.2.
Prerequisites
No prerequisite
Supported Metric
| Monitor Name | Metric Name | Metric Display Name | Unit | Description |
|---|---|---|---|---|
| AUS Array Status | aus.array.status | AUS Array Status | Monitors the current health of this array. Possible values are 1- unknown,2- other,3- okay,4- warning,5- failure.[OID: 1.3.6.1.4.1.795.14.1.1000.1.1.11] | |
| aus.array.type | AUS Array Type | RAID level used by this array. | ||
| aus.array.state | AUS Array State | Monitors the current health of this array. Possible values are 1- unknown,2- other,3- optimal,4- quickInited,5- impacted,6- degraded,7- failed,8- compacted.[OID: 1.3.6.1.4.1.795.14.1.1000.1.1.12] | ||
| AUS Controller Monitors | aus.controller.installed.memory | Installed Memory on AUC Controller | MB | Monitors the memory installed on this controller in megabytes.[OID: 1.3.6.1.4.1.795.14.1.201.1.1.12] |
| aus.controller.battery.status | AUS Controller Battery Status | Monitors the status of battery for this controller.[OID: 1.3.6.1.4.1.795.14.1.201.1.1.14] | ||
| aus.controller.oper.status | AUS Controller Operational Status | Monitors the operational status of this controller. Possible values are 1- unknown,2- other,3- okay,4- warning,5- failure.[OID: 1.3.6.1.4.1.795.14.1.201.1.1.15] | ||
| aus.controller.overall.status | AUS Controller Overall Status | Monitors the overall operational status of this controller and its children. This is the 'worst' status of the controller status and that of all arrays and un-arrayed devices attached to this controller. Possible values are 1- unknown,2- other,3- okay,4- warning,5- failure.[OID: 1.3.6.1.4.1.795.14.1.201.1.1.16] | ||
| AUS Device Status | aus.device.oper.status | AUS Device Operational Status | Monitors the operational status of the device. Possible values are 1- unknown,2- other,3- okay,4- warning,5- failure.[OID: 1.3.6.1.4.1.795.14.1.400.1.1.11] | |
| aus.device.type | AUS Device Type | Gives the device type for this device. | ||
| AUS Storage SMART Status | aus.storage.smart.status | AUS Storage SMART Status | Monitors the S.M.A.R.T. status of this storage device. Possible values are 1- unknown,2- notSupported,3- notEnabled,4- okay,5- errorPredicted.[OID: 1.3.6.1.4.1.795.14.1.410.1.1.8] |
IBM MQ - Hardware
Description
Template to monitor IBM MQ environmental sensors like System Temperature,CPU1 Temperature,CPU2 Temperature,CPU1 RPM,CPU2 RPM,Chassis1 RPM,Chassis2 RPM,Chassis3 RPM,Volt33,Volt5,Volt12,power supply status,IBM MQ current sensor value,environmental fan speed,other sensors value,other sensors reading status,temperature sensor value,voltage sensor reading. sysObjectID : 1.3.6.1.4.1.14685.1.8
Prerequisites
The device should have support for IBM-MQ-APPLIANCE-STATUS-MIB.
Supported Metric
| Monitor Name | Metric Name | Metric Display Name | Unit | Description |
|---|---|---|---|---|
| IBM MQ - Current Sensor | ibm.mq.current.sensors.value | Current Sensors Value | mA | It monitors the most recent reading of the current sensor in milliamperes.[IBM-MQ-APPLIANCE-STATUS-MIB::mqStatusCurrentSensorsValue:1.3.6.1.4.1.14685.4.1.261.1.2]. |
| IBM MQ - Environmental Fan Speed | ibm.mq.env.fan.sensors.speed | Environmental Fan Sensors Speed | rpm | It monitors the speed of the fan in revolutions per minute (RPM). Map component ID in graph/alert with below enum values 1: cpu-1,2: cpu-2,3: chassis-1,4: chassis-2,5: chassis-3,6: chassis-4,7: chassis-5,8: chassis-6,9: chassis-7,10: chassis-8,11: fan-tray-1-fan-1,12: fan-tray-1-fan-2,13: fan-tray-1-fan-3,14: fan-tray-1-fan-4,15: fan-tray-2-fan-1,16: fan-tray-2-fan-2,17: fan-tray-2-fan-3,18: fan-tray-2-fan-4,19: fan-tray-3-fan-1,20: fan-tray-3-fan-2,21: fan-tray-3-fan-3,22: fan-tray-3-fan-4,23: hard-disk-tray-fan-1,24: hard-disk-tray-fan-2,25: fan-1a,26: fan-1b,27: fan-2a,28: fan-2b,29: fan-3a,30: fan-3b,31: fan-4a,32: fan-4b,33: fan-1,34: fan-2,35: fan-3[IBM-MQ-APPLIANCE-STATUS-MIB::mqStatusEnvironmentalFanSensorsFanSpeed:1.3.6.1.4.1.14685.4.1.97.1.2]. |
| IBM MQ - Environmental Sensor | ibm.mq.env.sensor.system.temp | Environmental Sensor System Temperature | C | It monitors the environmental sensor system temperature.[IBM-MQ-APPLIANCE-STATUS-MIB::mqStatusEnvironmentalSensorssystemTemp:1.3.6.1.4.1.14685.4.1.55.1]. |
| ibm.mq.env.sensor.cpu1.temp | Environmental Sensor CPU1 Temperature | C | It monitors the environmental sensor CPU1 temperature.[IBM-MQ-APPLIANCE-STATUS-MIB::mqStatusEnvironmentalSensorscpu1Temp:1.3.6.1.4.1.14685.4.1.55.2]. | |
| ibm.mq.env.sensor.cpu2.temp | Environmental Sensor CPU2 Temperature | C | It monitors the environmental sensor CPU2 temperature.[IBM-MQ-APPLIANCE-STATUS-MIB::mqStatusEnvironmentalSensorscpu2Temp:1.3.6.1.4.1.14685.4.1.55.3]. | |
| ibm.mq.env.sensor.cpu1.rpm | Environmental Sensor CPU1 RPM | rpm | It monitors the environmental sensor CPU1 RPM.[IBM-MQ-APPLIANCE-STATUS-MIB::mqStatusEnvironmentalSensorscpu1rpm:1.3.6.1.4.1.14685.4.1.55.4]. | |
| ibm.mq.env.sensor.cpu2.rpm | Environmental Sensor CPU2 RPM | rpm | It monitors the environmental sensor CPU2 RPM.[IBM-MQ-APPLIANCE-STATUS-MIB::mqStatusEnvironmentalSensorscpu2rpm:1.3.6.1.4.1.14685.4.1.55.5]. | |
| ibm.mq.env.sensor.chassis1.rpm | Environmental Sensor Chassis1 RPM | rpm | It monitors the environmental sensor chassis1 RPM.[IBM-MQ-APPLIANCE-STATUS-MIB::mqStatusEnvironmentalSensorschassis1rpm:1.3.6.1.4.1.14685.4.1.55.6]. | |
| ibm.mq.env.sensor.chassis2.rpm | Environmental Sensor Chassis2 RPM | rpm | It monitors the environmental sensor chassis2 RPM.[IBM-MQ-APPLIANCE-STATUS-MIB::mqStatusEnvironmentalSensorschassis2rpm:1.3.6.1.4.1.14685.4.1.55.7]. | |
| ibm.mq.env.sensor.chassis3.rpm | Environmental Sensor Chassis3 RPM | rpm | It monitors the Environmental Sensor chassis3 RPM.[IBM-MQ-APPLIANCE-STATUS-MIB::mqStatusEnvironmentalSensorschassis3rpm:1.3.6.1.4.1.14685.4.1.55.8]. | |
| ibm.mq.env.sensor.volt33 | Environmental Sensor Volt33 | v | It monitors the Environmental Sensor volt33.[IBM-MQ-APPLIANCE-STATUS-MIB::mqStatusEnvironmentalSensorsvolt33:1.3.6.1.4.1.14685.4.1.55.10]. | |
| ibm.mq.env.sensor.volt5 | Environmental Sensor Volt5 | v | It monitors the Environmental Sensor volt5.[IBM-MQ-APPLIANCE-STATUS-MIB::mqStatusEnvironmentalSensorsvolt5:1.3.6.1.4.1.14685.4.1.55.11]. | |
| ibm.mq.env.sensor.volt12 | Environmental Sensor Volt12 | v | It monitors the Environmental Sensor volt12.[IBM-MQ-APPLIANCE-STATUS-MIB::mqStatusEnvironmentalSensorsvolt12:1.3.6.1.4.1.14685.4.1.55.12]. | |
| ibm.mq.env.sensor.power.supply.status | Environmental Sensor Power Supply Status | It monitors the environmental sensor power supply status.Possible values for power supply status are 1: ok,2: power-1-failure,3: power-2-failure,4: power-1-ac-lost,5: power-2-ac-lost.[IBM-MQ-APPLIANCE-STATUS-MIB::mqStatusEnvironmentalSensorspowersupply:1.3.6.1.4.1.14685.4.1.55.13]. | ||
| IBM MQ - Other Sensors | ibm.mq.other.sensors.value | Other Sensors Value | It monitors the value of the sensor. The value is either true or false.[IBM-MQ-APPLIANCE-STATUS-MIB::mqStatusOtherSensorsValue:1.3.6.1.4.1.14685.4.1.142.1.2]. | |
| ibm.mq.other.sensors.reading.status | IBM MQ Other Sensors Reading Status | It monitors the Other Sensors Reading Status.Possible values are 1: lowerNonRecoverable,2: lowerCritical,3: lowerNonCritical,4: ok,5: upperNonCritical,6: upperCritical,7: upperNonRecoverable,8: failure,9: noReading,10: invalid.[IBM-MQ-APPLIANCE-STATUS-MIB::mqStatusOtherSensorsReadingStatus:1.3.6.1.4.1.14685.4.1.142.1.3]. | ||
| IBM MQ - Temperature Sensor | ibm.mq.temperature.sensors.value | Temperature Sensors Value | Celsius | It monitors the most recent reading of the temperature sensor in degree Celsius.[IBM-MQ-APPLIANCE-STATUS-MIB::mqStatusTemperatureSensorsValue:1.3.6.1.4.1.14685.4.1.141.1.2]. |
| IBM MQ - Voltage Sensor Reading | ibm.mq.voltage.sensor.reading | Voltage Sensor Reading | mV | It monitors the most recent reading of the voltage sensor in millivolts.[IBM-MQ-APPLIANCE-STATUS-MIB::mqStatusVoltageSensorsValue:1.3.6.1.4.1.14685.4.1.140.1.2]. |
IBM MQ - Performance
Description
Template to IBM MQ performance parameters like memory utilization,memory used,free memory,cpu utilization,system uptime,cpu average load 5min,File System Encrypted Utilization,File System Temporary Utilization,File System Internal Utilization,Queue Manager Status,Queue Manager CPU Usage,Queue Manager Used Memory. sysObjectID : 1.3.6.1.4.1.14685.1.8
Prerequisites
The device should have support for IBM-MQ-APPLIANCE-STATUS-MIB.
Supported Metric
| Monitor Name | Metric Name | Metric Display Name | Unit | Description |
|---|---|---|---|---|
| IBM MQ - File System | ibm.mq.file.sys.encrypted.utilization | File System Encrypted Utilization | % | It monitors the file system encrypted utilization.[IBM-MQ-APPLIANCE-STATUS-MIB::mqStatusFilesystemStatusFreeEncrypted:1.3.6.1.4.1.14685.4.1.29.1,mqStatusFilesystemStatusTotalEncrypted:1.3.6.1.4.1.14685.4.1.29.2]. |
| ibm.mq.file.sys.temporary.utilization | File System Temporary Utilization | % | It monitors the file system temporary utilization.[IBM-MQ-APPLIANCE-STATUS-MIB::mqStatusFilesystemStatusFreeTemporary:1.3.6.1.4.1.14685.4.1.29.5,mqStatusFilesystemStatusTotalTemporary:1.3.6.1.4.1.14685.4.1.29.6]. | |
| ibm.mq.file.sys.internal.utilization | File System Internal Utilization | % | It monitors the file system internal utilization.[IBM-MQ-APPLIANCE-STATUS-MIB::mqStatusFilesystemStatusFreeInternal:1.3.6.1.4.1.14685.4.1.29.7,mqStatusFilesystemStatusTotalInternal:1.3.6.1.4.1.14685.4.1.29.8]. | |
| IBM MQ - Queue Manager | ibm.mq.queue.managers.status | Queue Managers Status | It monitors the run time status of the queue manager.[IBM-MQ-APPLIANCE-STATUS-MIB::mqStatusQueueManagersStatusStatus:1.3.6.1.4.1.14685.4.1.511.1.2]. | |
| ibm.mq.queue.manager.cpu.usage | Queue Manager CPU Usage | % | It monitors the instantaneous CPU usage by the queue manager as a percentage of the CPU load.[IBM-MQ-APPLIANCE-STATUS-MIB::mqStatusQueueManagersStatusCpuUsage:1.3.6.1.4.1.14685.4.1.511.1.3]. | |
| ibm.mq.queue.manager.used.memory | Queue Manager Used Memory | Mb | It monitors the amount of memory that is currently in use by the queue manager.[IBM-MQ-APPLIANCE-STATUS-MIB::mqStatusQueueManagersStatusUsedMemory:1.3.6.1.4.1.14685.4.1.511.1.4]. | |
| IBM MQ - System Performance | ibm.mq.memory.usage | Memory Usage (%) | % | It monitors the instantaneous memory usage as a percentage of the total memory.[IBM-MQ-APPLIANCE-STATUS-MIB::mqStatusSystemMemoryStatusMemoryUsage : 1.3.6.1.4.1.14685.4.1.505.1]. |
| ibm.mq.memory.used | Memory Used | MB | It monitors the amount of memory that is currently in use. The used memory equals the amount of total memory minus the amount of free memory. The used memory does not include any hold memory.[IBM-MQ-APPLIANCE-STATUS-MIB::mqStatusSystemMemoryStatusUsedMemory:1.3.6.1.4.1.14685.4.1.505.3]. | |
| ibm.mq.memory.free | Memory Free | MB | It monitors the amount of memory that is currently not in use and is therefore available. The free memory value includes any hold memory that is not currently in use.[IBM-MQ-APPLIANCE-STATUS-MIB::mqStatusSystemMemoryStatusFreeMemory:1.3.6.1.4.1.14685.4.1.505.4]. | |
| ibm.mq.cpu.avg.load.5min | CPU Avg Load 5Min | % | It monitors the the average CPU load over the last 5 minutes.[IBM-MQ-APPLIANCE-STATUS-MIB::mqStatusSystemCpuStatusCpuLoadAvg5 : 1.3.6.1.4.1.14685.4.1.521.3] | |
| ibm.mq.cpu.usage | CPU Usage (%) | % | It monitors the instantaneous CPU usage as a percentage of the CPU load.[IBM-MQ-APPLIANCE-STATUS-MIB::mqStatusSystemCpuStatusCpuUsage:1.3.6.1.4.1.14685.4.1.521.1]. | |
| ibm.mq.system.uptime | IBM MQ System Uptime | s | It monitors the total amount of time the appliance has been up since the last reload or reboot.[IBM-MQ-APPLIANCE-STATUS-MIB::mqStatusDateTimeStatusuptime2: 1.3.6.1.4.1.14685.4.1.3.6] |
IBM MQ Software - Channel Monitoring
Note
This template will be deprecated soon.Description
IBM MQ Software - Channel Monitoring
Prerequisites
No prerequisite
Supported Metric
| Monitor Name | Metric Name | Metric Display Name | Unit | Description |
|---|---|---|---|---|
| IBM MQ Software - Channel Monitoring | ibm.mq.admin-api.channel.state | Channel State | NULL | State of the channel |
IBM MQ Software - Queue Manager
Note
This template will be deprecated soon.Description
IBM MQ Software - Queue Manager
Prerequisites
No prerequisite
Supported Metric
| Monitor Name | Metric Name | Metric Display Name | Unit | Description |
|---|---|---|---|---|
| IBM MQ Software - Queue Manager | ibm.mq.admin-api.qmgr.channel-initiator-state | Queue manager channel initiator state | NULL | Channel initiator state for the queue manager |
| ibm.mq.admin-api.qmgr.state | Queue manager State | NULL | The queue manager state of the queue managers to retrieve. | |
| ibm.mq.admin-api.qmgr.connection-count | Queue manager connection Count | count | Connection count for the queue manager |
IBM MQ Software - Queue Monitoring
Note
This template will be deprecated soon.Description
IBM MQ Software - Queue Monitoring
Prerequisites
No prerequisite
Supported Metric
| Monitor Name | Metric Name | Metric Display Name | Unit | Description |
|---|---|---|---|---|
| IBM MQ Software - Queue Monitoring | ibm.mq.admin-api.queue.open-input-count | Queue open input count | count | Queue open input count |
| ibm.mq.admin-api.queue.last-get | Queue last get | s | Queue last get | |
| ibm.mq.admin-api.queue.oldest-message-age | Queue oldest message age | s | Oldest message age of the queue | |
| ibm.mq.admin-api.queue.last-put | Queue last put | s | Queue last put | |
| ibm.mq.admin-api.queue.uncommitted-messages | Queue uncommitted messages | count | Queue uncommitted messages | |
| ibm.mq.admin-api.queue.current-depth | Queue Current depth | count | Current depth of the queue | |
| ibm.mq.admin-api.queue.open-output-count | Queue open output count | count | Queue open output count | |
| ibm.mq.admin-api.queue.queue-depth-percentage | Queue depth percentage | % | Queue depth percentage for the queue |
IBM TS3200 - Global & Library Status
Description
Monitors the IBM TS3200 global status and library state.[IBM-3200-MIB :: ibm3200StatusGlobalStatus : 1.3.6.1.4.1.2.6.211.2.1.0,libraryState : 1.3.6.1.4.1.2.6.211.3.1.1.2]
Prerequisites
Device must have support for IBM-3200-MIB
Supported Metric
| Monitor Name | Metric Name | Metric Display Name | Unit | Description |
|---|---|---|---|---|
| IBM TS3200 - Global Status | ibm_ts3200_GlobalStatus | IBM TS3200 Global Status | Monitors the ibm TS3200 global status.[IBM-3200-MIB :: ibm3200StatusGlobalStatus : 1.3.6.1.4.1.2.6.211.2.1.0].Possible values are other(1),unknown(2),ok(3),non-critical(4),critical(5),non-Recoverable(6) . | |
| IBM TS3200 - Library State | ibm_ts3200_LibraryState | IBM TS3200 Library State | Monitors the ibm TS3200 library state.[IBM-3200-MIB :: libraryState : 1.3.6.1.4.1.2.6.211.3.1.1.2].Possible values are other(1),unknown(2),ok(3),non-critical(4),critical(5),non-Recoverable(6). |