Dashboard
Update to the Logs Tile for List View Enhancement
The Logs Tile now supports list visualization, allowing user to see data in a list format.
For more information, refer to Logs Tile.
Update to the Metrics Tile Enhancement
The Metrics Tile now has enhancements to the visualization of metrics data. When the tile is maximized, the metrics data can be displayed in a table format with minimum, maximum, and average values.
For more information, refer to Metric Tile.
Update to Audit Details Enhancement
The Audit Logs now show details for new, updated, or deleted dashboards, dashboard tiles, and dashboard collection.
For more information, refer to Audit Logs.
Core Platform
Log Label Support for Custom Attributes Enhancement
A new field called Log Label is now available in the Custom Attribute UI. This allows you to designate specific custom attributes as log labels for better enrichment of logs.
Note: To ensure optimal performance, a maximum of 5 log label attributes can be assigned per resource. There are no limits on the number of disabled log label attributes.
See Custom Attributes for more information.
Resource Management
Added Last Executed timestamp for Resource Groups Enhancement
The last executed timestamp for resource groups will now be displayed for the following actions:
- Addition or removal of resources
- Any actions performed within the resource group such as assigning articles, jobs, or custom attributes.

See Manage resource groups for more information.
Updates to Credentials Management Enhancement
The following changes have been made to the Credentials listing screen:
- The Assigned Resources section is removed from the Add and Edit screens of Credentials. You can continue to bulk assign resources using Device Management Policy (DMP) or Resource Groups.
- The number of assigned resources is now displayed on the listing page for quick reference.
- You can unassign resources from the Assigned Resources window.


See Credentials for more information.
Templates option is moved under View Monitoring Configuration Enhancement
The Templates option in the Metrics tab is now available in the View Monitoring Configuration option. To access this option, in the Metrics tab, click the gear icon to the right corner of the screen, as shown in the following image:
![]()
The Metric Configuration page is displayed where you can see the list of assigned templates and the option to assign a new template to a resource.

See View Monitoring Configuration for more information.
Event Management
Yearly Option Added to Scheduled Maintenance Enhancement
You can now schedule maintenance activities to recur on specific dates within selected months each year.
This enhancement offers greater flexibility in scheduling recurring maintenance windows for specific months.
Example: You can set maintenance to occur on the 1st and 2nd of January, February, and March each year, from 9:00 AM to 10:00 AM.

See Scheduled Maintenance for more information.
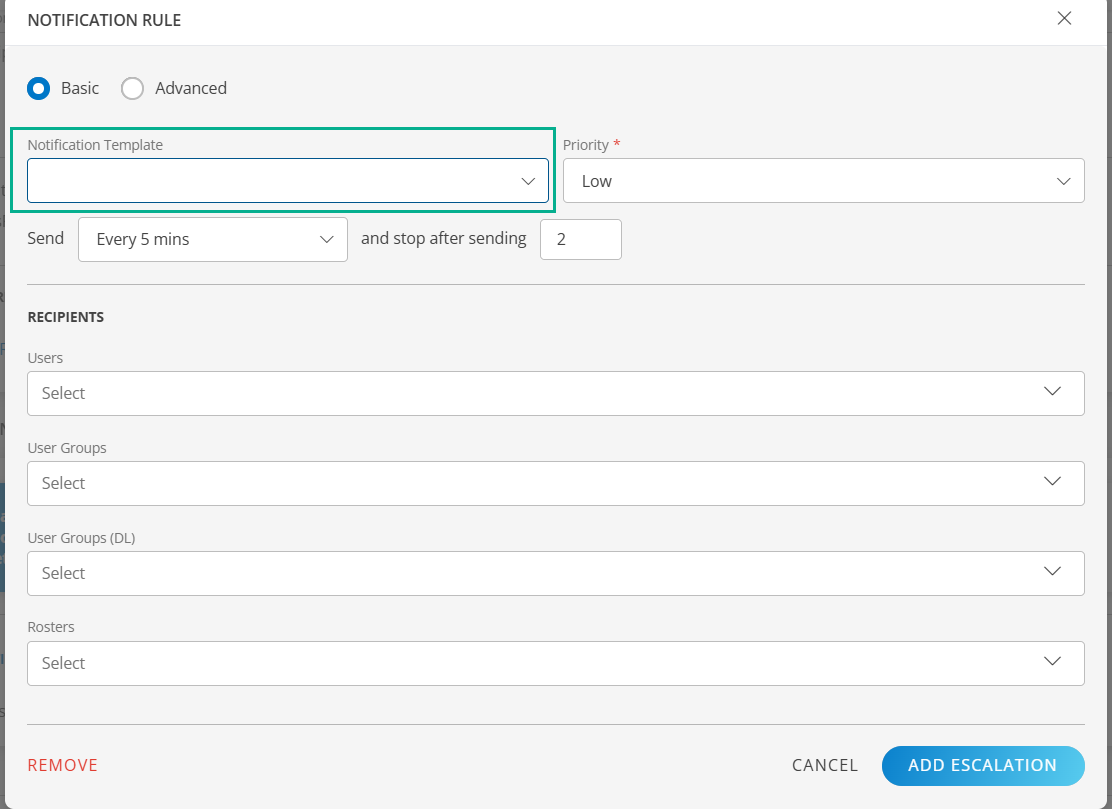
Custom Notification Templates for Alert Escalation Policies Enhancement
Users can now assign separate notification templates to each alert escalation policy, allowing for more tailored and specific alert communications.
Manual De-correlation of Acknowledged Alerts Enhancement
Users can now manually de-correlate acknowledged alerts, providing greater control over alert management and resolution.
Support for Attaching Inference Alerts to Open Incidents Enhancement
New inference alerts can now be linked to an existing open incident when the corresponding service desk incident setting is enabled. This enhancement improves incident correlation by ensuring that related alerts are grouped together, providing better context and reducing incident noise.
Log Management
Custom Attributes for Logs Enhancement
Customers can now choose which custom attributes should be available on logs by enabling the Log Value option in the Custom Attributes section and assigning them to resources. By default, these custom attributes will be attached to the logs if the resourceUUID is found in the source log. This will enable the user to filter logs based on the custom attributes chosen.
For more information, refer to Addition of filter to service overview page and Custom Attributes for Logs with Resource UUID.
Log Enrichment with Source Tags Enhancement
Added an optional and customizable method for customers to identify the source resource from which logs originate by configuring Log Enrichment Configs with the Source Tags option. Based on this configuration, the system will identify the resource and its custom attributes and attach them to the logs.
For more information, refer to Source Tags.
Monitoring Management
Support for Separate Repeat Count and Alert Operators for Synthetic Monitoring Templates Enhancement
You can now configure the alert operator and repeat count separately for both warning and critical thresholds. This enhancement provides additional flexibility and ensures that the Synthetics templates' metric threshold configurations are in sync with the regular G2 monitoring templates. As a result of this, the alert subject and description will contain the warning and critical operators and thresholds.
Earlier, the repeat count and alert operator were the same for both warning and critical alerts. This results in a slight change to the alert subject, and the description will include the warning and critical operators and thresholds.
Example: Problem with location availability for TCP-2 (https://www.opsramp.com), the down location count is 2 which breaches the configured threshold (Critical: >= 1, Warning: >= 1)
Additional Info:
- 19.0.0 – Name or service not known
- CG 19.0.0 – Name or service not known
Problem with HTTP response time for HTTP-5(http://www.example.com) being monitored from 18 gateway for v2 synthetics, the response time is 40 ms which breaches the configured threshold (Critical: >= 40, Warning: >= 30)
Network Performance Management (NPM)
Introduction of Total TCP Connections Column Enhancement
A new Total TCP Connections column has been added to the Network Performance Management (NPM) interface. This column tracks and displays the number of new connections established during a specific conversation.
The data is derived from TCP flag information within the flow, providing users with accurate visibility into how many new connections were initiated. This feature enhances connection-level analysis, offering deeper insights into network behavior and traffic patterns.

Tracing
Service Insights 2.0 Enhancement
Apart from trace service metrics like Latency, Error rate, Throughput, and Operations overview, the new Trace Service Insights page provides below useful information related to corresponding resources that are part of the selected trace service. These details help users to correlate traces, metrics, logs and alerts. The following are the new tabs included in the Service 2.0 page.
- Infrastructure Metrics: Resource-specific infra metrics combined with golden signals like latency, error rate, and throughput for precise analysis.
- Alerts: Displays alerts generated against resources of the trace service, such as memory or metric threshold breaches.
- Logs: Includes logs from associated resources/pods to assist with debugging.
- Topology: Visualizes the relationships and dependencies among resources with a connected map.
For more information, refer to Service 2.0.
Added new Infrastructure Filter Enhancement
The Service Insights page introduces an Infrastructure filter that includes Kubernetes cluster name, namespace, and object details for the trace service. This filter simplifies resource identification and trace association.
Note
The Service Insights 2.0 page is accessible only when traces are ingested through the Kubernetes 2.0 Agent and the trace collection flag is enabled. Without these prerequisites, advanced insights are unavailable.For more information, refer to Addition of filter to service overview page.
Tracing Proxy Collector V19.0.0 Enhancement
- Added support for service insights 2.0, including specific attributes and metric labels.
- Introduced functionality for mapping namespaces to application names via the NamespaceAppMap configuration.
- Introduced a new collector_metrics_labels_series metric.
Reporting Apps
Update to Patch Details App Enhancement
The Patch Details App has been updated to include the attributes for the Patch Install Policy and Schedule report.
A new column, Patch Conf Policy, has been added to the Patch Details App. This column provides essential information about the schedule for the patch configuration job, including specific timelines. Additionally, it outlines the type of policy, helping the user easily understand which patch configuration job the patches were installed against. If any patches fail, the user will be able to take immediate remedial steps.
For more information, refer to Patch Details.
Update to Availability Reports App Enhancement
The Availability Reports now includes a new configuration parameter for Select Availability State. This parameter comes as a part of the Resource parameter and allows users to select one, multiple, or all choices to view a detailed resource availability analysis by availability states.
The options are Up, Down, Unknown, or Undefined. This selection is optional. If nothing is selected, it will default to Down time. Users can select single, multiple options or all of them to see a comprehensive analysis based on the chosen availability states.
For more information, refer to Availability Reports.
Update to Ticket Details App Enhancement
The Ticket Details App no longer has the attribute for attachRequests. This field has been removed from the attribute selection in order to improve the app’s performance and prevent API failures due to large ticket volumes.
For more information, refer to Ticket Details.
Public Cloud
Improved Graph Plotting Consistency for Meraki Metrics Enhancement
Resolved inconsistency in graph rendering where, in the absence of components, the component name was incorrectly shown as the metric display name. Graphs now correctly plot at the metric level when components are not applicable.
Users may notice a change in the line color in time-series graphs. This color shift represents the initiation of a new graph stream, replacing the previous one. The change ensures better visual clarity and accurate data representation, specifically impacting Meraki-related metrics.
See G2 Templates Support for more information.
Credential Validation for SaaS applications Enhancement
Currently, SaaS app installations and updates accept all credentials without performing any validation, with credential checks occurring only during the scan phase. A new mechanism has been implemented to validate credentials during the installation and update processes. Moving forward, if invalid credentials are entered while installing a new integration or updating an existing one, an error message will be displayed, ensuring that only valid credentials are accepted.
Updated Subcategories for SaaS-Based Applications Enhancement
To enhance platform structure and improve user experience, subcategories for several SaaS-based applications have been updated. These changes enhance clarity and ensure each application is accurately categorized, making it easier for users to locate and manage them within the platform.
Updated Subcategory Assignments:
- Zoom – Now under Collaboration
- Office 365 – Now under SaaS Applications
- Apigee Edge – Now under SaaS Applications
- Megaport – Now under Software Defined WAN
- Citrix Cloud VDA Service – Now under Virtualization
- VMware SD-WAN (VeloCloud) – Now under Software Defined WAN
- Oracle Cloud – Now under Public Cloud
- Juniper Mist – Now under WIFI Network
- Cloudflare – Now under Network Security
- Starlink – Now under Network Services
- CrowdStrike – Now under Network Security
- Cisco Intersight – Now under SaaS Applications
- Aruba Central – Now under Network
These reclassifications support better navigation and consistency across the platform.
Service Maps
Ability to Auto-refresh Service Map Enhancement
You can refresh a service map to view the latest availability status of nodes by using the REFRESH option available on Service Map page. When you open a service map, the refresh option works as follows:
Manual Refresh: Allows you to manually refresh the service map to reflect the node availability status instantly.
Auto-refresh: Allows you to schedule refresh frequency for a specific time interval, for example, 5, 15, or 30 minutes.

See Refresh Service Maps for more details.
Ability to Expand/Collapse the Service Map Enhancement
The expand/collapse feature of a service map feature provides visibility to all the underlying nodes. You can double-click on a node to expand/collapse the complete Service Map or the underlying nodes.


Ability to Filter the Service Map Nodes Enhancement
You can filter the nodes of a service map based on the availability status (Down, Up, or Degraded) by using the Node Status option available in the top right corner of the Service Map page. You can select one or more statuses, and the service map will filter and highlight the nodes accordingly.

Ability to View Connection Path to Root Node Enhancement
You can view the connection path from any node to its root node. This provides you with quick access to root node from any node, no matter how big the hierarchy of service map is. You can click on any child node in the service map. You will see a dotted line connecting that node to its parent node.

See Working with Service Map Nodes for more details.
Updates in Upcoming Release
Inclusion of Windows Service Name along with Display Name Enhancement
After the installation of the OpsRamp agent on Windows OS, the
INVENTORY → SERVICES section displays Service Name.

The Service Name shown in the current UI is not the actual service name, but the Display Name. Thus, OpsRamp is introducing a new column called
Display Name to show the current information. The existing Service Name column will display the actual Service Name.
An example of Display Name and Service Name is shown below:
The following pages will be updated:
- New Resource View page:
- In the RESOURCE → INVENTORY → SERVICES page, you will see
Display Name, followed by Service Name.
- In the RESOURCE → INVENTORY → SERVICES page, you will see
- Report:
- In the Report → Reporting Apps → Software Inventory page, a new column will be shown in the Report.
Exclude IPs option in SNMP, SSH, and WMI Discovery Enhancement
The upcoming Gateway release will introduce a field called Exclude IPs in Discovery for SNMP, SSH, and WMI protocols, which will allow the user to mention specific IP addresses or a range of IP addresses, which will be excluded by the Gateway.
Example: Exclude IPs: 1.1.1.2 - 1.1.1.50.
In this case, the Gateway will consider all other IPs, except the specified IP range.
Deprecation Notice
Deprecation of AWS OpsWorks Resource Support Enhancement
Support for AWS OpsWorks resource monitoring has been deprecated in both new and existing AWS accounts.
Why Is This Feature Being Deprecated?
AWS has officially deprecated the OpsWorks resource feature. As a result, attempting to retrieve OpsWorks data during scans via AWS APIs introduces unnecessary overhead and affects monitoring efficiency. To prevent performance issues, we are discontinuing support for this feature.
Impact on Users
- AWS OpsWorks resources will no longer be included in new scans or integrations.
- Monitoring will be more efficient, reducing unnecessary data processing.
- Existing integrations that relied on OpsWorks data will no longer fetch or display OpsWorks-related information.