Week of November 29, 2024 (2024.11-U1)
Dashboards
Introduced the new NetFlows tile with extended support for OpsQL, enabling enhanced visualization and analysis of NetFlow data:
- OpsQL Support for NPM Data Series: Leverage OpsQL to query and analyze network performance metrics.
- Enhanced Visualization: Use the NetFlow tile to create dashboards that provide clear insights into network performance.
This feature allows you to analyze Layer 3 performance between various sources and destinations within your infrastructure, offering deeper visibility into traffic patterns and network health.

You can now perform the following actions on a curated dashboard:
- Copy a curated dashboard and customize it to meet your business requirements.
- Export the curated dashboard in JSON format.

You can now define minimum and maximum threshold values or a range of values on a time series graph. These settings help you visually assess whether a metric is performing within the desired range, as indicated by the metric data.
- Threshold Representation: Defined thresholds are displayed as lines on the graph.
- Range Representation: Defined ranges appear as colored regions on the graph.
This feature simplifies analysis by allowing you to quickly identify anomalies or performance issues, enabling faster and more effective decision-making.

See Visualization for more information.
You can now view the details of resource(s) that are impacted due to scheduled maintenance activities, in the Schedule tile. The Schedule tile displays a count of affected resources, and clicking this count provides a list of those resources with details.
This enhancement helps you quickly identify and review the specific resources impacted by maintenance, ensuring better planning and management.

Service Maps
The Service Maps interface has been upgraded to provide a more intuitive and efficient user experience. This enhancement streamlines navigation, improves visualization, and offers enhanced functionality for managing your IT services.
Highlights of the New UI
- Modernized Layout:
- Redesigned interface with a clean, user-friendly layout for better readability and interaction.
- Improved hierarchy visualization with a focus on clarity for parent-child relationships.
- Slide-Out Details Panel:
- Quickly access Alerts, Incidents, and Impacted Resources in a dedicated slide-out screen.
- Perform detailed searches and navigate directly to related pages
(e.g., Alert Browser, Resource Overview).
- Enhanced Filtering Capabilities:
- Filter Service Maps by type (Standalone or Linked) and availability status
(Up, Down, or Degraded). - New multi-select filtering ensures quick and precise views of relevant maps.
- Filter Service Maps by type (Standalone or Linked) and availability status
- Improved Node Configuration:
- Simplified workflows for adding and managing parent and child nodes, including service and resource types.
- Updated Availability Threshold settings with clear descriptions and visual indicators.
Network Topology Management (NTM)
You can now create bulk maintenance schedules directly from the topology page. This enhancement simplifies scheduling and ensures efficient maintenance management across multiple network components.
How It Works:
- From the topology view, you can select multiple nodes or links at once.
- Configure a shared maintenance schedule by specifying start and end times, as well as recurrence options.
- Apply the schedule to all selected network components in a single action, eliminating the need to configure maintenance schedules individually.

Log Management
OpsRamp now supports MsgPack integration with both FluentD and Fluent Bit. This addition ensures seamless data handling and compatibility with FluentD and Fluent Bit setups.
Tracing
You can now navigate directly from the Traces Explorer page to related logs in the Logs Explorer using the Trace ID. This enhancement allows you to quickly identify and analyze logs associated with a specific trace, improving observability and accelerating issue resolution.
Public Cloud
- OpsRamp now supports integration for monitoring AWS FSx file systems, including Lustre, NetApp ONTAP, OpenZFS, and Windows File Server.
Key Capabilities:
- Metric Collection: Monitor key metrics such as data read/write, operations, client connections, and utilization.
- CloudTrail Events and CloudWatch Alarms: Gain comprehensive monitoring and alerting for FSx file systems with support for CloudTrail events and CloudWatch Alarms.
This integration provides detailed insights into FSx file systems, enabling better performance tracking and issue resolution.
OpsRamp now extends its infrastructure monitoring capabilities to include Serverless ElastiCache, complementing the existing ElastiCache monitoring support. You can:
- Leverage automatic scaling to adjust capacity based on workload demands.
- Optimize costs with flexible caching tailored to variable workloads.
Integrations Framework
OpsRamp now supports Prometheus Remote Write integration at the partner level. With this enhancement, you can:
- Add the label “clientID” to metric series in Prometheus.
- Directly send metrics to the partner-level integration.
- Automatically route metrics to the appropriate client based on the clientID label.
This feature simplifies the management of Prometheus metrics in multi-client environments, ensuring seamless routing and scalability.

SaaS Application
Enhanced the Starlink integration by introducing template support for alerting and availability monitoring of Starlink User Terminals.
In addition to existing capabilities for discovering and monitoring key metrics like throughput, latency, and signal quality, you can now create custom alerting templates to monitor availability and address service issues more efficiently.
Resource Management
You can now view a list of all matching policies applied to a device on the New Resource details screen. The policies include:
- Device Groups
- Service Groups
- Sites/Locations
- Custom Attributes
- Credentials
- Jobs
- Knowledge Base (KB) Articles
- Availability Rules
- Monitoring Templates
This enhancement helps you provide a centralized and organized view of all policies applied to a specific device, enabling you to quickly identify applied policies, simplify troubleshooting, and streamline policy management.

Event Management
You can now manage multiple maintenance windows at a time. Instead of handling each window individually, you can select multiple windows and apply the desired action, all in a single operation.
- End active maintenance windows.
- Resume previously suspended windows
- Suspend active maintenance windows.
- Remove pending or completed maintenance windows that are no longer needed.
This streamlines maintenance window management and saves time.
See Manage scheduled maintenance for more information.
Process Automation
- You can now leverage Role-Based Access Control (RBAC) to manage access to v2Jobs and v2Scripts directly from the Automation tab, ensuring secure and controlled access.
- The new v2Jobs page now includes a search feature and category filter, making it easier to locate and organize jobs efficiently. This update significantly improves usability and resolves navigation challenges.
Reporting App
The Reporting App now includes enhanced sharing and notification capabilities for analyses within the Partner Scope. Key enhancements include:
Partner users can share analyses with client users based on roles. This client sharing option becomes available only when a partner user selects a particular client from the configuration parameters section. Here the loaded roles are specific to this selected client in configuration parameters.

Partners can notify designated clients about generated reports. Now partner users can send the notification to client users and client user groups whenever the user selected any specific client in configuration parameters. Notifications are automatically sent after a scheduled run is completed, with the report attached for quick access.
A Cancel option is now available for pending and in-progress runs in the recent/view runs sections. You can stop operations if they take longer than expected or are no longer needed.


You can now export reports in CSV format for further analysis. This feature is currently available for:

The Network Utilization App now includes a filter option in OpsQL and column support in reports to identify and focus on WAN link interfaces. It helps to:
- Easily distinguish between normal and WAN link interfaces.
- Filter and view utilization metrics specific to WAN link interfaces for more targeted analysis.

Week of October 31, 2024 (2024.10-U1)
Dashboards
Following enhancements are done in Dashboards:
- New capabilities for OpsQL query tiles now allow flexible, user-driven data visualization.
- You can create tiles that display data in a tabular format across Alerts, Resources, and Tickets without needing a GroupBy clause. Selected columns show all rows matching the query in a structured row/column format.
- Key functionalities include:
- Filtering rows by selected columns.
- Viewing suggested columns if no custom columns are specified.

- IT teams using dashboards in the Operation Center can now enable an auto-refresh feature that updates data every 3 minutes, ensuring real-time monitoring.
Event Management
Multiple OK alerts sent to OpsRamp Cloud within a 1-minute interval are now consolidated into a single alert.
Patch Management
The Patch Management module now supports custom tiles. You can create personalized tiles by clicking + ADD on the Patch dashboard to tailor the interface as per your specific needs.

See Patch Overview Page for more details.
Process Automation
Added support for the $utils.timeStamptoDate token to format timestamps according to specified time zones within entities like alerts, incidents, resources, tasks, and JSON objects.
Network Performance Management (NPM)
Following enhancements are done in NPM:
- You can assign custom application names for ports, displayed on the NPM Top Applications dashboard. If not configured, global port names are used, prioritizing client-level mappings over global settings.
- You can configure custom alert criteria in NPM using an OpsQL query. These custom metrics can be utilized to create dashboards and set up alerts, enhancing monitoring and insight capabilities.

Core Platform
SNMP, SSH, and WMI discovery activity will now be shown directly in Integration against each discovery configuration
Navigation: Setup > Account > Integrations. Click on the three dots against the discovery configuration and click on View Logs.
Prior to this, the scan status displayed logs for both Success and Failure. With Gateway release 18.2.0 you will see the details of success and failed devices in the View Logs section.
Metrics Engine
Following enhancements are done in Metrics Engine:
- The new Metrics Explorer allows you to:
- Quickly search and visualize metrics based on the matched metric name.
- Customize the query and tile as per your requirements.
- Add the tile to the dashboard for easy access and monitoring.
- This significantly improves your ability to efficiently access and analyze relevant data.

- If an alert definition generates over 1,700 alerts in 1 hour, a Warning Alert notifies users of the high volume. If alerts exceed 2,000 in 1 hour, the system will:
- Automatically disable the alert definition.
- Trigger a Critical Alert to notify users.
- Generate a Failure log with details on the alert definition and metrics.
Tenancy and RBAC
The Administrator can now use the new My Profile Edit permission to grant users with view-only access to the My Profile section. This will restrict the users from updating their profile details, ensuring enhanced security and safeguarding sensitive information.
| Classic UI | New UI |
|---|---|
Navigation: Setup → Accounts → Permission Sets | Navigation: Setup → Account → Users and Permissions tile → Permission sets |
Reporting Apps
Following enhancements are done in Reporting Apps:
- Introduced new Netflow Insights. It provides insights into data trends and network traffic patterns. It offers:
- Data Flow Visualization: Shows data movement between source and destination points.
- Top Utilization Analysis: Identifies the network devices with the highest utilization, enabling you to optimize resource allocation and performance.

- Enhanced the Ticket Details App by adding resource-related attributes such as resource name, IP address, device group name,location etc. These attributes are utilized to accurately identify the associated resources, groups, and locations with the corresponding ticket.
It also includes the Absolute Response Time, Absolute Resolution Time, and SLA Summary etc. - Metered Usage Insights App now includes integration name and provider type in the Unweighted and Weighted Resource Types Break Down under the Resource Type Break Down Tab.
- Audit logs can now track create, update, or delete actions on runs and analyses in reporting apps.
Resource Availability Calculation
The Resource Availability Report has been enhanced to more accurately reflect availability for resources onboarded after the report’s Start time.
Previously, availability was calculated for the full report period, with any days prior to a resource’s onboarding marked as UNDEFINED.
Now, if a resource is onboarded after the report’s Start time, its creation date will be used as the starting point for availability calculations. This change ensures that availability is calculated only from when the resource was onboarded, providing a clearer and more accurate view of resource availability in your reports.
Public Cloud
Following enhancements are done in Public Cloud:
- Following the May 2024 deprecation notice, the “Install Agent” option is now completely removed from Cloud Integrations.
- The Azure metric support has been expanded to include the following Azure resources.
- CDN profiles
- Container registries
- MySQL flexible servers
- PostgreSQL servers
- Application gateways
- Azure Firewalls
- ExpressRoute circuits
- Load balancers
- Virtual hubs and
- SQL databases
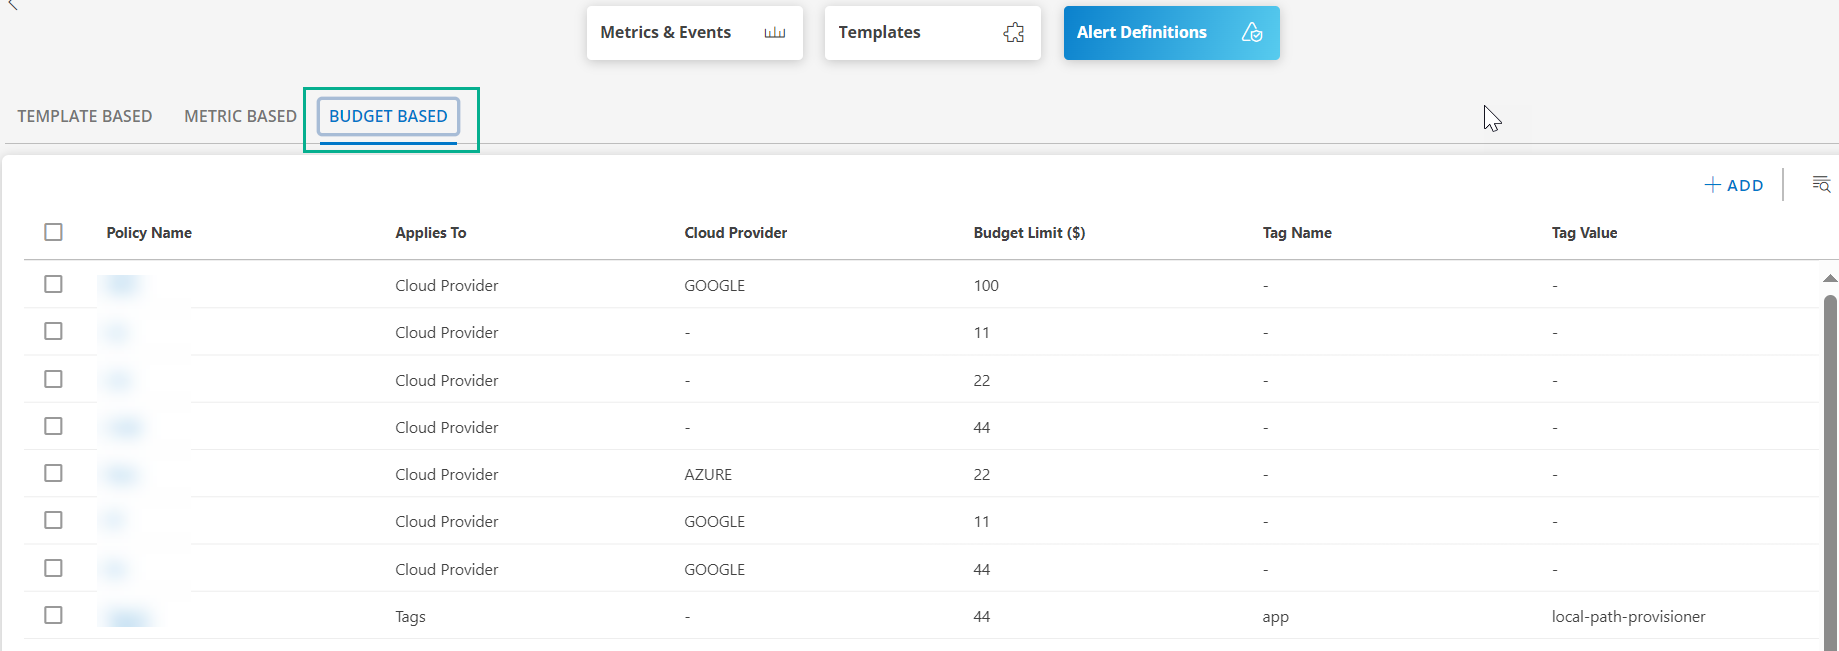
- The new improved UI of the Budget policies can now be found under the Monitoring > Alert Definitions > Budget-Base. It allows you to access and perform all operations seamlessly from the new UI.
Tracing
Following enhancements are done in Tracing:
- Added filter ingested traces using the traceId attribute on the Trace Explorer page.
- The Traces Usage page displays the ingestion usage of spans in gigabytes (Gb), in addition to the existing spans count dashboard tiles.
- Introduced a new tracing metric, traces_ingestion_usage, to provide traces ingested usage in bytes, with metric labels for service and app, which can be utilized in dashboard tiles.
- Tracing service maps have been introduced at both the trace level and application level, providing enhanced visibility into trace data.
Integration Framework
The roles that are shown in Custom Integration (for Custom category) will now include:
Organisation-level roles in Custom Integrations are now selectively displayed, showing only roles with permissions equal to or less than the user’s context role, both in the UI and API responses. Additionally, key secret regeneration is restricted, allowing only users authorized for a specific role to perform this action, thereby enhancing security and control.

The Available Integrations page now includes a section for Featured Integrations. These integrations are readily available at the Client level, allowing you to easily configure and manage them across the environment.

Updates in Upcoming Release
AWS Type Management
Once the AWS integration is installed, updating its Access Type through the UI is disabled. Although it remains possible through the API, this has created inconsistencies between UI and API behavior. To ensure alignment and streamline processes, the ability to update the AWS access type via the API will also be disabled. Starting with the November release, customers who wish to change the AWS type will need to uninstall the existing integration and reinstall it with the desired AWS type.
Deprecations
Alert Statistics Dashboard
Starting November 2024 release, the Alert Statistics dashboard will no longer be available from the list of curated dashboards.
It will be replaced by the new Alert Policies Overview page under Setup > Account.
See Deprecation Notices for more details.
Custom Attributes
The Classic Custom Attribute feature, available under Setup > Custom Attributes, will be deprecated effective December 2024. After this date, all users are encouraged to transition to the new Custom Attributes under Setup > Account > Custom Attributes to benefit from an improved user experience.
See Deprecation Notices for more details.
Week of September 30, 2024 (2024.09-U1)
Dashboards
Following enhancements are done in Dashboards:
- You can now explicitly set a desired range by defining the minimum and maximum values for a given metric tile. This allows you to visually observe when values exceed or fall below the defined range, enabling you to take appropriate action quickly.

Dashboards are now auto-refreshed every 3 minutes ensuring that your IT teams always see the latest data in visualization without manually refreshing every time.
A new tabular visualization for all the tiles has been introduced to show the OpsQL data in Table form to observe the interested attributes of a domain object like alert, tickets and Resources.
 |  |
Synthetics
We are relocating the Synthetics feature within the platform to improve accessibility and streamline its management.
Note
- The v2 Synthetics feature will be available for use once the synthetic data has been successfully migrated.
- Once the data migration is completed, the v1 Synthetics UI will be fully deprecated, and only v2 Synthetics UI will be available for use.
Previously, you could access the Synthetics feature under Infrastructure > Resource > Synthetics. However, this feature will now be fully moved to a new location: Setup > Account > Integrations within the Web Services category.
UI changes between v1 Synthetics and v2 Synthetics:
| v1 Synthetics | v2 Synthetics |
|---|---|
| Synthetic resource created via Infrastructure > Resources | Created via Setup > Account > Integrations > Synthetics |
| Permission: Only required device level permissions | Permission: Required integration (manage) permission to create synthetic resources |
| Monitoring template parameters configured in the Templates | Parameters moved to the Synthetic Integration configuration page |
| Synthetic resource details shown in Resource Details | Moved to Overview Page (last updated, response time, uptime/downtime) |
| Resource-level APIs used for onboarding synthetics | Use Integration-related APIs for synthetics onboarding |
| Monitors tab available for configuring monitors | Monitors tab removed; template assignment and thresholds done under Metrics > Templates |
| Response Log & Availability Log available in the Overview tab | Removed from Overview; now in Availability Timeline and Metric Graphs |
| Location Availability Tab present with location details | Same, but with improved location segregation and RCA view |
| Standard UI layout | Improved UI with more intuitive navigation |
See v2 Synthetics documentation for more details.
Synthetics Public Collectors
Response times for redirected URLs may appear higher due to an update in the curl library’s internal latency calculation. This adjustment reflects more accurate measurement of redirection times.
Note
The above changes will reflect after the Synthetics collector migration.Monitoring Management
You can now view the Template Applied Time for resources discovered via SDK Applications in Integrations. To access this information, navigate to
Infrastructure → Resources → Resource → Monitors.
Note
The Applied Time will only be displayed if the collector profile (Classic and NextGen Gateway) is version 18.1.0 or higher.
Log Management
You can now revoke webhook tokens used in Logs Ingestion. When a token is revoked, a new token is automatically generated to replace the existing one. This capability allows you to invalidate tokens when they are no longer needed or if security concerns arise, giving you enhanced control and security over your log ingestion processes.
Patch Management
You can now search automation scripts and filter based on names in the automation section.
Network Topology Management
Following enhancements are done in NTM:
- The topology view now supports Alert filters (Duration and Metric), allowing users to filter and display the required alert count based on selected metrics and time periods. This enhancement provides better visibility and control over alert data on the topology.

- A Full Screen option has been enabled for topology maps, which allows you to view the maps on larger screens for enhanced visibility and improved monitoring of network and resource relationships.
Resource Management
The Infrastructure resource details feature is a Beta version designed to enhance the User Interface. It allows you to easily explore and switch between different sections. As a Beta version, it offers early access to these features, giving you the chance to provide valuable feedback that will help guide future enhancements.
The transformed interface offers a user-friendly experience, providing quick access to key areas.
Navigation: Access the new interface from Infrastructure → Search.
The various sections have been rearranged and displayed as tabs.
While the previous location (Infrastructure → Resources) still exists, we recommend using the new path (Infrastructure → Search) for better user experience.
| Classic UI | Enhanced UI |
|---|---|
Available in left navigation under Infrastructure → Resources | Available as Tabs under Infrastructure → Resources |
You will see a Back to Old Experience button at the top of the new resource details screen. By clicking this button, you can revert to the previous UI and continue using the interface you are familiar with. This option is provided to ensure a smooth transition as you adapt to the new design.
Reporting Apps
Following enhancements are done in the Reporting Apps:
- The Availability Details app displays the following columns in the reports after selecting the resource or service group from the Availability by option.
- Ticket Id
- External Ticket Id
- The Asset Inventory app included the following columns:
- VM power state (Power State)
- Description (Description)
- Uptime of the resource.
- Enhanced the Monitor Details app by adding the following new attributes:
- Location
- Last Updated
- Created Source
- First Created Date
- Device Groups Name
- Enhanced the Audit Details apps by including OpsQL query, this will help users to filter specific data.
See Reporting Apps documentation for more details.
Public Cloud
Following enhancements are done in the Public Cloud:
- The Manage Resources API GET response will now include the provider’s last scan time for public cloud resources such as AWS, Azure, and GCP and other cloud resources. This enhancement allows users to view the most recent scan time directly in the API response, improving visibility into cloud resource monitoring.
- We have improved our CrowdStrike integration to include host discovery (and reconciliation in the case an agent or gateway is installed) as well including events and logging out-of-the-box.
Integration Framework
The SNMP Traps Configuration and Syslog Monitor Configuration features available under Setup → Monitoring are now available as Integrations under the SNMP and Events categories respectively and can be accessed from Setup → Account → Integrations.
While you can still access both the features from the previous location
(Setup > Monitoring), we recommend using the new UI, which provides an improved and user-friendly experience.
Note
The SNMP Traps Configurations and Syslog Monitor Configurations underSetup → Monitoring are only viewable.
| Classic UI | Enhanced UI |
|---|---|
Available in left navigation under Setup → Monitoring | Available as tiles under Integrations |
See SNMP Traps Configurations and Syslog Monitor Configurations documentation for more details.
Alert Definitions
The Alert Definitions feature is now generally available, with the beta flag removed under Setup > Account > Monitoring. Users can now create alerts on metrics and traces using PromQL queries. The maximum number of alert definitions that can be created per client is 25.
See Alert Definitions for more details on the new V3 Alert Definition APIs.
API Enhancements
- The Create Run API will now return a 201 status code instead of 200 when creating a new report.
- New V3 APIs for Resource and Service Map node availability have been released for querying resource and service map node availability.
- A new V3 Release Version API is available to retrieve the OpsRamp platform version.
Updates in Upcoming Release
Permission-Based Access
For security reasons, a new permission-based access feature has been introduced for the Configuration Backup option for network devices:
- By default, the Configuration Backup option will not be visible unless the user has the necessary permissions.
- The Network Configuration tab under the resource will only be accessible to users with NCM View permissions or higher.
- The Set as Baseline option will only be available to users with NCM Manage permissions or higher.
Cloud Resource Availability
As of May 2024, we have decided to no longer consider the “cloud.instance.state” metric as an availability metric in all global templates. Please refer to the initial deprecation announcement for more details.
Starting in November 2024, this change will take effect. If you are using global public cloud templates, your cloud resources may enter an “UNDEFINED” availability state. The metric “cloud.instance.state” will continue to be available, but it will no longer be used as a default availability check in global templates. To maintain availability monitoring, we recommend creating a copy of the global template, selecting a preferred availability metric, and reassigning the customized template in place of the global one.
Note
This change applies exclusively to global templates and will not impact any service provider (SP), partner, or client-specific templates.Deprecations
The Legacy Scripts feature, formerly accessible through Automation > Scripts will be deprecated from effective date (February 2025). As part of our deprecation process, we have eliminated all associated actions from the UI.
The SNMP Traps Configuration and SysLog Monitor Configuration, accessible through Setup → Monitoring will be deprecated from effective date (December 2024). You can access the New UI by navigating to Setup → Account → Integrations.
See the deprecation notice for details.
Week of August 31, 2024 (2024.08-U1)
Dashboards
You can now share entire Dashboard Collections or individual dashboards from a collection with other users in your tenant, expanding accessibility and collaboration. Previously, you could share individual dashboards, but now you have the added flexibility to share specific dashboards from a collection without sharing the entire collection. Once you share a collection or individual dashboards, a shared icon will appear for easy identification. This update allows for more granular control over how you share and manage access to dashboards.
Kubernetes 2.0
Developed Kubernetes 2.0 integration is controlled by a feature flag and is disabled by default. To enable this feature, contact OpsRamp support. as an improved version of our existing Kubernetes integration. As a key advancement in the cloud-native space, Kubernetes 2.0 enhances resource visibility and troubleshooting, providing essential tools for managing modern, containerized workloads at scale.
The key features of Kubernetes 2.0 are as follows:
- Supports nodes, pods, namespaces, services, PVs, PVCs, daemonsets, and deployments.
- Visual representation of resource relationships for easier troubleshooting.
- Pre-configured and fully customizable dashboards to meet specific monitoring needs.
Public Cloud
Following enhancements are done in the Public Cloud:
- You can now onboard all Azure subscriptions using a single service principle at the tenant level.
- The Azure integration now supports Azure Backup Protected Items Discovery and Monitoring. This enhancement allows for comprehensive visibility and management of Azure Backup protected items, ensuring better oversight and monitoring of your backup resources.

See Azure Tenant Integration for more details.
Log Management
Following enhancements are done in the Log Management:
- Introduced a Live Tail option (real-time streaming of logs) that allows you to monitor incoming logs in real-time based on the selected logs query. The real-time monitoring provides instant visibility into system events and errors, eliminating the need to refresh or manually retrieve data.
- You can now enrich logs by adding or updating attributes based on defined rules in the cloud. Attributes are automatically applied to logs when matched against these rules, and the necessary attribute data is picked up from a CSV file uploaded to the cloud.
See Configure Logs Enrichment for more details.
Event Management
If a event log metric is associated with multiple templates, the specific template information will not be displayed in the alert details.
Network Topology Management
You can now toggle between viewing L2 (Layer 2) Topology and L3 (Layer 3) Topology within the same resource group. This enhancement provides a more streamlined and efficient way to analyze and manage network layers without navigating to different sections.
Monitoring Management
Enhanced the template audit reporting with the following changes:
Detailed Change Logs: You can now view specific metrics recently updated or modified, along with any availability and configuration parameters added or removed from a template.
Metric Modifications: The report now has Metric Updated label if there are changes within the template, including:
- Warning/Critical operators
- Warning/Critical thresholds
- Alert Repeat count
- Alert enablement status
- Alert on missing components enablement status
Before this update, the audit report simply showed a Monitoring template updated label without specifying which metrics were impacted. These enhancements provide you with a clear and detailed view of all modifications, thereby improving your ability to manage and audit template configurations effectively.
Process Automation
To improve the flexibility and precision of our notification system, we’ve introduced a new toggle switch for managing SMS and voice notifications. You can now easily enable or disable SMS and voice notifications without altering the existing content setup.
 See Notification Template for Process Definition - New for more details.
Patch Management
Following enhancements are done in the Patch Management:
- The Windows Server Update Service (WSUS) settings have been moved from the Infrastructure > Resource page to the Patch Management section.

- Added Escalate Maintenance Alerts When Period Ends checkbox in the Schedule section of the patch configuration process. This helps in managing alert escalations more effectively by automatically escalating active alerts once the scheduled maintenance period concludes. This ensures that any critical alerts are promptly addressed, enhancing response times and operational efficiency.

Export
Enhanced the streaming export with smart filter support. You can filter specific alerts and direct them to your chosen destinations. With this, you can determine which event resource types are to be shared with external parties. This focused approach ensures that only relevant data is communicated, improving both the security and efficiency of your data management.
Reporting Apps
Following enhancements are done in the Reporting Apps:
We have expanded the Monitor Details app to include the new attributes, providing you with clearer and more comprehensive information about the monitoring processes and the service names associated with the monitors you are using.
Enhanced the Network Utilization reporting app by adding the new attributes. This provides you with deeper insights into the Network Utilization applications.
Added user and console-type filters. These filters allow you to view the sessions performed by specific users and the sessions based on console types in a report.
Enhanced the Availability Details app by incorporating synthetic transaction availability metrics for script type synthetic resources. This provides you with deeper insights into the performance and reliability of your synthetic transactions.
- Detailed Availability Metrics: You can now analyze the percentage of availability for each individual transaction within your synthetic scripts.
- Breach and Error Tracking: Monitor breaches and errors to identify issues and optimize performance more effectively.
- Location-Specific Analysis: Assess the performance of each script type synthetic resource at every configured location, giving you a comprehensive view of transaction success and challenges across your network.
API Framework
- A new Get Resources V3 API has been released to retrieve details of all resources assigned to a template.
- The Search Logs API is now available, allowing you to fetch logs for improved log management and analysis.
Updates in Upcoming Release
Resource Availability
Resource Availability Report will be improved to calculate availability for resources that were not onboarded at the report’s Start time.
Current BehaviorThe availability report considers the entire period between the Start time and End time for all resources. Resources onboarded after the report’s “Start time” are marked as UNDEFINED for the days before they were onboarded.
New BehaviorResources created on or before the report’s Start time will continue to be evaluated for the full report period. Resources onboarded after the Start time will have their creation time considered as the Start time for availability calculation. This eliminates the need to mark them as UNDEFINED for the period before they were onboarded.
ExampleFor June 1, 2024 to June 30, 2024 report period, resources 1, 2, and 3, which were onboarded before June 1, will have their availability calculated for the entire month. Resource 4, onboarded on June 16, 2024, will have its availability calculated from June 16 onward, without any UNDEFINED period for the first 15 days. This change is scheduled for implementation in October 2024 and will be available in production starting November 2024.
Device Management Policies
We will be reorganizing the Device Management Policies (DMPs) in the upcoming releases, by splitting them into two distinct sections based on their actions, streamlining navigation and management:
Monitoring Actions:
Actions such as Assign Availability Rule and Assign Monitoring Template will now be found under Account -> Monitoring -> Alert Definitions -> Template Based. This change centralizes monitoring-related configurations in one accessible location.Other Actions:
Other actions including Assign Custom Attributes, Assign KnowledgeBase Articles (available at client level only), and Assign Credentials (also client-level only) will be relocated to Infrastructure -> Groups when creating a group. This adjustment aligns these actions more closely with their usage contexts.
Changes to Job Assignments: The Assign Jobs Action will move to Automation -> Jobs Menu and will no longer be listed as an action within DMPs. This ensures a more focused approach to automation by integrating job assignments directly within the automation menu.
These updates enhance the logical organization of DMPs, making it easier to navigate and manage various actions according to their operational focus and utility.
Synthetics
We are introducing key changes to the Synthetics UI and configuration process in the upcoming release (October 2024):
- UI Changes: We are transitioning the existing Synthetics UI to a new and improved UI/UX. As part of this transition, the configuration has moved from the Infrastructure -> Resource section to the Setup -> Integrations section.
- Permissions: To configure Synthetics, users must have Integration Manage permissions.
- Configuration: All Synthetics configuration parameters will now be managed through configuration page rather than a template-based system.
- API Update: Due to these changes, users should no longer use the Creates Resource and Manage Resources V2 API for Synthetics configuration. Instead, use the following V3 Integrations API for configuration management.
Week of July 31, 2024 (2024.07-U1)
My Profile Section
The My Profile section now has an enhanced user interface for a more user-friendly experience. You can manage the following from the My Profile section:
- View and update your profile information with ease.
- Monitor your login activity.
- Manage your browser console settings.
- Customize your notification preferences effortlessly.
Hover over your avatar in the top-right corner and click My Profile to access the new UI.

Scheduled Maintenance
All customers can now access the redesigned Scheduled Maintenance UI. This new interface offers an enhanced user experience with updated design elements and improved navigation.
You will see a Back to Old Experience button at the top of the Scheduled Maintenance screen. By clicking this button, you can revert to the previous UI and continue using the interface you are familiar with. This option is provided to ensure a smooth transition as you adapt to the new design.

Event Management
Following enhancements are done in the Event Management:
- When you select the update incident option, the alert subject can now be updated when the alert state changes for an existing incident.

- In the Custom (Event) integrations, a new Ignore Repeat Alert Noise property has been introduced. This property allows you to ignore repeated alerts of the same state that occur every minute from third-party monitoring tools for 6 hours. However, if there is a change in alert state, it will be processed immediately.
- The maximum number of resources that can be manually added in the Assigned Resources section while creating a scheduled maintenance window has been increased from 50 to 100. The increased limit simplifies the process by allowing more resources to be managed at once.

Monitoring Management
Previously, the Templates screen in the Setup > Monitoring > Templates displayed the device count in the Devices column, indicating the number of devices assigned to each template. Now, to see the list of associated devices, you must click view in the Devices column for each template.
Log Management
You can now export logs collected by OpsRamp to a Splunk endpoint using the Stream Exports integration. This enhancement enables seamless log data transfer for more efficient analysis and monitoring within Splunk, ensuring all critical log data is readily available for comprehensive evaluation.

Resource Management
OpsRamp will automatically change the state of a resource from unmanaged to managed, if it receives a third-party alert on the unmanaged resource. If this is not the intended behavior, you should ensure that inbound alert integration does not send alerts for unmanaged resources.
SaaS Apps
Added a new Edge Link Utilization metric for Velocloud that measures the use of the network links at the edge of a network, typically at the point where it connects to external networks. This metric shows the link speed based on the bytes received and bytes sent.
Public Cloud
Following enhancements are done in the Public Cloud:
- A new Stream Meraki Events option has been added to collect events for networks occurring within the networks associated with the Meraki integrated organizations.

- A new Virtual Local Area Networks (VLAN) checkbox has been added as a resource option in the Meraki integration. This option allows you to easily discover and monitor VLAN configurations.

- The support for AWS Elastic Disaster Recovery has been provided during AWS integration. This discovery allows you to quickly recover applications and data from physical, virtual, or cloud-based infrastructure in the event of a disaster.
Resource Availability
Resource Availability is now calculated and marked as UNKNOWN if the availability metric frequency is up to 60 minutes.
Previously, the maximum frequency was 30 minutes. With this release, it has been increased to 60 minutes. This change allows you to use the availability metric with a higher frequency. If a metric marked as an availability metric with a frequency of 60 minutes or less stops sending data, the availability state will be changed to UNKNOWN.
Process Automation
Following enhancements are done in the Process Automation:
- Removed the dependency on metadata from the Notification Templates field. This enhancement simplifies the configuration and usage of notification templates.
- Added three new attributes to the Incident Management APIs for Process Automation . These attributes include:
parentId, attachedRequests, and subject.
Reporting Apps
Following enhancements are done in the Reporting Apps:
- Enhanced Remote Control Usage session details to include the session ID, Partner, Client Name, and End Time in the session details section.
- Enhanced the Asset Inventory app by adding the following new columns to support and align it with the classic inventory report.
- DHCP Enabled
- Warranty Expiry Date
- Provider Type (alternative to Is Cloud Instance)
- Hardware Version
- Gateway Profile IP Address
- DRAC IP
- Introduced the Topology Details application to provide users with in-depth insights into the relationships between their source and target resources. This application enhances infrastructure visibility, empowering users to better understand their network and system connections.

Exports
The batch export response will now have the following new fields related to Metric unit:
- unit
- unitLabel
- factor
You can see that the following changes when you export the JSON file:
- The Contextid in the JSON file is in the new format: 28ca2a12-1855-44b7-9588- b0dd7eed42b6. Earlier, it used to be in 112098 formats.
- The file name format is also changed as follows, including the new format of Contextid - b0dd7eed42b6. recurring_metrics_**28ca2a12-1855-44b7-9588-b0dd7eed42b6**_2024-08-05_06-00-00_8f0508d4-47ac-54ee-a266-6f0cf71c2d6c_1722838804993.json
See Export document for more details.
Integration Framework
Following enhancements are done in the Integration Framework:
- The existing data of Batch and Streaming Export available under Setup > Exports is moved to Setup > Account > Integrations.
In Setup > Exports, you have read-only access for batch export and streaming export. - You now have the flexibility to provide either a DNS Name or an IP address when configuring Pure Storage and VMware integrations.
- You can now create and update incidents bidirectionally (inbound and outbound) for the ManageEngine ServiceDesk Plus – Cloud application.
API
Enhancements
A new SAVE METRIC TIMESERIES API has been added for posting metric data, replacing the existing V2 API. See Metrics and Metrics/Data for more details.
Deprecations
- The public PATCH V2 Baseline and Compliance APIs will be deprecated as they no longer support the latest Patch 2.0 Baseline and Compliance functionalities.
- As part of the decommissioning of the Legacy Metrics page, the V2 Metrics APIs will be deprecated.
Updates in Upcoming Releases
In the upcoming release, the following SCIM provisioning changes will be introduced for supported SSO applications like PingOne, AzureAD, and Okta:
- User Deactivation: When a user is deactivated in the SSO application, the user will also be deactivated in OpsRamp.
- User Activation: When a user is activated in the SSO application, the user will be activated in OpsRamp.
- User Deletion: When a user is deleted from the SSO application, the user will be terminated in OpsRamp.
Deprecations
- As announced in March 2024, we are fully decommissioning the Legacy Metrics Page and replacing it with Metrics. The new Metrics page will manage all metric data. You can access the new metrics page by navigating to Infrastructure > Resources > Metrics. The new navigation pane looks as follows:

- The Custom Report option in Report > Reporting Apps > Custom Report will be removed in October. You will not be able to create new custom reports.
- The Jobs feature in Automation > Jobs will be removed in November. You will not be able to create new automation jobs.
- The Launch Instance option for Cloud Integrations will be deprecated in September.
Week of June 30, 2024 (2024.06-U1)
User Interface Enhancements
Metrics
Metric graphs are now updated every minute. They display data with a default 1-minute interval, aligning with the Metrics standard on the following pages:
- Alert Browser
- Resource-level Interface Page
- Synthetic Resource Landing Page
Previously, the display frequency depended on the monitoring frequency. Now, it is standardized to a 1-minute plotting frequency for all graphs.
Check out the following GIF displaying both the changes:
Previous behavior with the graph updating every 5 minutes

Current behavior with the graph updating every 1 minute

See Graphs with New Metrics data for more details.
Dashboards
Dashboard tiles are now dynamically populated with OpsQL query/API responses, ensuring real-time data updates and insights. Introduced new tiles for Unique IP, Unique IP/Port pairs, and Total Bytes providing comprehensive data coverage and insights within the NPM Dashboard UI.
OpsRamp Agent
The following updates have been made to enhance OpsRamp Agent:
Navigation and Availability
- The OpsRamp Agent is now available under Setup > Account > Integrations, listed under the Servers and VMs Integration type.
- Separate tiles are provided for Linux-based and Microsoft Windows-based Agents.
Installation
You can select the Agent as per your operating system, choose the Agent type – Direct or Proxy using the toggle button, and install the Agent.
Update Agent and Resource Management
The Update Agents option is added to Setup > Accounts > Integrations. In the Update Agents screen, you can:
- Select the resources and choose Update now, Update on schedule, or Do not allow from Actions.
- View the number of resources added under each Agent displayed under the Instances column.
- Filter the resources based on Update State and Update Status. You can see the pane on the left side to filter the resources
- You can access the App definitions from Agent Integration now for the app configuration.
Transition Information
While the existing Agent UI is still available, we recommend you explore Agent lifecycle management from the Integrations UI.
In upcoming releases, the existing Agent UI will be phased out.

Collector Profile
The following changes have been made in the collector profile UI page:
- Provided supported version option in gateway collector listing page
- Provided collector profile description field.
- Provided admin UI username and password details for classic gateway instructions page.
- Detach gateway consequences as warning messages based on the gateway model.
- Updated the instructions page of both Classic gateway and NextGen gateways to mask the SSH credentials. This enhancement ensures better security and prevents unauthorized access by concealing sensitive information.
- The maximum upgrade profile selection count increased to 20.
Resource Groups UI enhancements
Articles, Credentials and Custom Attributes are added to the create and update resource group screens in a tabbed layout. You can assign or unassign these while creating or updating a resource group.

Process Automation UI
We have made several UI enhancements to improve the process automation feature:
- Updated Landing Page: The process automation landing page now follows the latest UI standards, listing all configured process definitions.
- Hamburger Menu: Added a Hamburger button, which includes links to Process Definition, Running Process Instances, Completed Process Instances, and other related links.

- Count Data Display: The landing page now shows count data based on the configuration type of process definition, such as the count for timerStartEvent.
- Process Instance Page: Transformed the UI of the process instance page.
- Filter Options: Added filtration options to list process definitions based on different event types (Signal, Timer, All, None).
- Statistics Tab: Each process definition now has a statistics tab providing detailed information on process instances and executed object IDs, reducing the number of clicks for users.
- Property Panel: Developed a property panel to check the initial parameter configuration for designing workflows without needing to enter the process definition, reducing clicks.
- Audit Enhancements
- Audits process definition changes, instance triggers, and definition triggers.
- Provides detailed change logs, including who made changes and when.
Tenancy Management
The newly designed Tenant Management has been added to Setup > Account > Settings > Account Settings screen. It offers an easy-to-understand interface, allowing you to quickly navigate between tabs such as Account, Add-ons, Security, and Branding to view and edit account information. This streamlined interface enhances your ability to manage tenant settings efficiently.
While the previous location (Setup > Accounts) still exists, it is recommended to use the new path to get an improved user experience.
- Log Management and Trace Management that are available under client details (Setup > Accounts > Clients) are now listed under Add-Ons.
- Custom Branding that is available under Setup > Accounts is renamed as Branding.
| Classic UI | Enhanced UI |
|---|---|
 |  |
Network Performance Monitoring
The Network Performance Monitoring (NPM) is now generally available (GA) and the beta flag for NPM has been removed. As of now, it is available on request.
The redesigned NPM Dashboard enhances functionality, improves data visibility, and promotes a user-centric experience. Key features updated as part of the UI transformation include all existing views such as Top Conversations, Top Applications, Top Protocols, Top Source Endpoints, and Top Destination Endpoints.

Feature Enhancements
Integrations
- The integration installation process now only displays the latest version of the application, instead of all available versions, for a streamlined user experience.

- Native Type resource attribute support has been extended to the following Integrations:
|
|
|
|
|
|
|
|
|
|
|
|
|
|
|
|
|
|
|
Once you discover integrations, you can now:
- View the native resource type in the resource details page.
- View the resources grouped by native type in the Infrastructure > Search listing screen.

For SNMP integrations, you can view the Native type against the Object OID in the SNMP Resource Type Definitions listing screen. For these changes to reflect, rescan/discover all the previously discovered integrations.
- The Batch Export and Streaming Export features are now available as Integrations under the Exports category, and can be accessed at Setup > Account > Integrations.
Note
This feature is currently available at the Partner level. While the previous location (Setup > Exports) still exists, we recommend using the new UI for improved user experience.
| Classic UI | Enhanced UI |
|---|---|
Available in left navigation under Setup | Available as tiles under Integrations |
AWS Gateway deployment
You can now deploy the Gateway in your AWS environment by creating a Gateway collector profile. After receiving access confirmation from OpsRamp support, deploy the Gateway in AWS.
Monitoring Management
Updated Device view details on the Templates listing screen. Previously, when you navigated to Setup > Monitoring > Templates, the device count was displayed in the Devices column next to each template, indicating the number of devices assigned to each template. Now, the device count is no longer displayed directly on the listing screen. Instead, you can click on the VIEW link next to each template to see the list of associated devices.
Event Management
- Custom Attributes are now visible directly in the alert slide-out pane when selecting an alert. This enhancement allows quick access and review of detailed information associated with each alert without navigating away from the alert pane.

- You can now personalize the subject and description of alert definitions using custom labels. Custom labels provide flexibility to adapt alert messages to different use cases and operational scenarios, enhancing the utility and effectiveness of alert communications.
Reporting Apps
Following enhancements are done in the Reporting Apps:
- A new Cloud Cost Trends and Insights application has been introduced to display cloud costs, trends, and insights. This application provides detailed data on cloud cost usage and visualizes trends over time, enabling you to analyze and understand your cloud spending patterns easily. With these insights, you can make informed decisions to optimize your cloud usage.

This new application replaces the cloud cost insights and trend widgets in the classic dashboard.
Patch Details application is now enhanced with the following new fields and attributes to help you quickly assess the patch status and requirements of your resources.
- Patch Configuration Job Name: Easily identify if resources are configured for any patch windows.
- Next Job Scheduled Time: Check the next scheduled patch job time for failed patches needing remediation.
- Is Reboot Required: Determine whether the resources in the patch configuration job require a reboot.
Metered Usage Insights application now supports NetFlow logs.
- New Unit of Measure: NetFlow logs usage is now included in the “Events, Logs, and Traces Usage” unit of measure. This allows users to see detailed data on network traffic logs, captured from supported protocols and ports.
- Supported Protocols: The NPM collector now supports SFlow, NetFlow v5, NetFlow v9, and IPFIX protocols, providing extensive coverage of network flow records.
Device Management Policy
You now have an option to include or exclude clients while modifying an existing Device Management Policy (DMP).
Note
This improvement allows modifications to be made to an existing policy without any need to create another policy.

Log Management
In Dashboards 2.0, you can now add logs_ingestion_usage metric to the Metric tiles. This feature enables you to track and visualize logs usage for the selected clients across different sources, levels, and hosts.

- Added a new Scheduled option in the Log Alert Definition page to configure a recurring schedule in the log configuration settings. You can now schedule log monitoring on a daily, weekly, or monthly basis. You can receive alerts when specific log messages are detected within the scheduled time frames, for quicker response to potential issues.

See Alerting based on Logs for more details.
- Added the new Metric tab, enabling you to define custom log metric names and queries for precise monitoring.
- Custom Log Metrics: You can define unique log metric names and associated queries, similar to the log explorer.
- Seamless Integration: Calculated metrics and their counts are integrated into Dashboard 2.0 for centralized and intuitive visualization.

Our log management system now supports enhanced alert definitions with the following scheduling options.
- Daily, Weekly, and Monthly scheduling patterns.
- Ability to specify specific days of the week (example: Monday, Tuesday)
- Start and end times for log management alerting.
Tracing
Trace Alerts generated from Alert Definitions will now have their alert type explicitly set as Trace. This ensures that these alerts are easily identifiable and can be managed more effectively.
Public Cloud
The Device status metrics collection process is improved as follows:
- Single API Call: Device status metrics are now collected through a single API call at the integration level, instead of individually for each device.
- Aggregated Data: Status metrics for all devices are aggregated every 5 minutes and can be visualized through graphs based on template assignments.
- Reduced API Calls: This implementation reduces the frequency of API calls, minimizing the risk of hitting rate limits imposed by Meraki.
The Azure integration has been improved to include support for Azure Service Vault Replicated Items: During Azure integration, selecting the Recovery Service Vault checkbox now enables the discovery of replicated items. Key metrics and attributes pulled from Azure resources include:
Metrics:
- Recovery Point Objective (RPO) in seconds.
- Pending data at source VM (dataPendingAtSourceAgentInMB)
Attributes:
- Replication Health
- Status
- Agent Version
See Azure Recovery Services Vault for more details.
Network Configuration Management
The Network Configuration Management (NCM) is now generally available (GA) and the beta flag for NCM has been removed. The NCM feature is currently available for both Arista and Cisco NX-OS products.
Modern enterprise networks are Hybrid and multi-vendor spanning across geographic locations. The network configuration compliance is vital to ensure operational and performance goals as well as security goals. Compliance may also involve adhering to the latest industry standards like HIPAA and other standards.
OpsRamp’s NCM offers a policy-based solution that monitors network configuration of all the network devices in a centralized location. It provides a Governance model to enable network admin to remediate configuration drift and remain compliant.
The following are the key functionalities of NCM:
- Automated and Scheduled Network Configuration backup.
- Notification on variances between configurations on a resource.
- Manual and policy-based restoration to Baseline Configuration.
- Policy-based Network Configuration Compliance.
- Policy-based Remediation with Governance Model.
- Dashboards for Compliance and Remediation Tasks.
- Configurable Compliance and Remediation workflows with process automation.
Network Performance Monitoring
The Network Performance Monitoring (NPM) collector installation now comes with pre-configured default metrics, and the NPM overview dashboard is enhanced with the following tiles to monitor the health and usage statistics of the NPM collector.
- Tile 1 (Total Usage in GB): Displays the overall disk usage during the current month’s billing cycle. It resets to 0 on the 1st of every month. Alerts are generated when the usage threshold is about to be breached.
- Tile 2 (Average Usage in GB): Shows the average disk usage during the current month’s billing cycle.
- Tile 3 (Data Usage in GB): Provides information on current disk usage from the last 7 days.
- Tile 4 (Status): Indicates the Collector application Status (1/0) for the last 7 days. Alerts are generated if the metric value is down or no data is generated for a while, based on the alert definition configured.
- Tile 5 (Flow Rate): Displays the collector flow rate for the last 7 days. Alerts are generated if the flow rate deviates from the configured alert definition.
- Tile 6 (Flows Rejected): Shows the count of collector-level flows rejected.
API Enhancements
Updated the error responses for the GET Resource API.
Previous Response: 500 Internal Server Error when resources are not found.
New Response: 404 Error Not Found when resources are not found.
Updates in upcoming releases
Deprecations
- The Agent Custom Monitors option in Setup > Monitoring > Agent Custom Monitors will be removed in the August release. You will not be able to create new monitors, but your existing monitors that are part of the template will continue to work. As a replacement, you can create a template with Metrics Adaptor Type: Application and Application Type: Remote Script Executor.
See the deprecation notice for details.
- The Windows Service Configuration option in Setup > Monitoring > Windows Service Configuration will be removed in the August release. You cannot exclude Windows Services from this page after this update.
See the deprecation notice for alternative options.
Movements
- Agent download option from Setup > Downloads > Agent will be moved to the Setup > Account > Integrations by August 2024. You can install the agents by searching for the Linux OS and Microsoft Windows OS integrations under Servers and VMs.
- Setup > Monitoring > Update Agents option will be completely moved to Setup > Account > Integrations by August 2024. Kubernetes agent flavors will be part of the integrations K3s, Kubernetes, OKD, and MicroK8s under the Container Orchestration category.
- Starting from October 2024, the Infrastructure > Resource > Synthetics feature will be completely moved to Setup > Account > Integrations under the Web Services category.
- The Gateway download option in Setup > Downloads > Gateway will be moved to Setup > Account > Collector Profiles by August 2024.
- The Device Management Policies option in Setup > Resources > Device Management Policies will be moved to Setup > Account > Monitoring > Alert Definitions by August 2024.
- The Templates option in Setup > Monitoring > Templates will be moved to Setup > Account > Monitoring > Template by August 2024. All the existing templates will be working in the new location seamlessly.
- The Metrics option in Setup > Monitoring > Metrics will be moved to Setup > Account > Monitoring > Metrics & Events by August 2024.
- The Events option in Setup > Monitoring > Events will be moved to Setup > Account > Monitoring > Metrics & Events by August 2024.
- The Assign Templates option in Setup > Monitoring > Assign Templates will be moved to the Infrastructure > Search by August 2024.
- The SNMP Trap Configuration option in Setup > Monitoring > SNMP Trap Configuration will be moved to Setup > Account > Integrations. OpsRamp will migrate your SNMP Trap Configurations to the integrations.
- The Syslog Monitor Configuration option in Setup > Monitoring > Syslog Monitor Configuration will be moved to Setup > Account > Integrations.
Week of May 31, 2024 (2024.05-U1)
Click here to view 2024.05-U1 Release Notes
User Interface Enhancements
Auto-create and add Metrics Tile to Dashboards
You can now auto-create a Metrics tile from metric graph visualizations in Metric 2.0 tab and add them to an existing dashboard or a new dashboard. This feature enables users to add the most frequently used or important metrics to dashboards with fewer clicks thereby improving the user experience.

Enhanced UI/UX for Email Alerts and Custom Integrations
The Email Alerts Integration has the following enhancements for improved UI/UX for better usability:
- Improved UI for integration configuration.
- Improved navigation to add integration and alert rules.
- Assign templates from the contextual menu.

The Custom integration that was previously available with five categories in it is now split as separate integrations for each category:
- Custom
- Custom (Ticketing)
- Custom (Event)
- Custom (SSO)
- Custom (Automation)
| Feature | Old UI | New UI |
|---|---|---|
| Integration Selection | You could select from five types of integrations using a single tile with a dropdown list. | Each integration type has its own dedicated tile, categorized by integration type. |
| Placeholder Options Display | Suggested values for the Placeholder options were displayed on the right-hand side of the screen. | The placeholders have been integrated into the fields. By default, these fields are empty. Type a $ symbol for the predefined options to appear. You can then select from the list of options. |

Custom Attributes
The Custom Attributes card has been added to Setup > Account. The enhanced UI provides a streamlined experience that allows you to configure custom attributes and assign them to the resources.

While the previous location (Setup > Custom Attributes) still exists, we recommend using the new path to improve user experience.
Reporting Apps
The following reporting apps have been updated to enhance your data analysis and monitoring capabilities:Metered Usage Insights:
- New Pricing Model Integration: Ensure accurate and transparent billing with the new pricing model, aligning to three key Units of Measure (UoMs) – Metrics Usage, Events/Logs/Traces Usage, and a summary of your usage over the billing period.
- Enhanced Visibility: Gain deeper insights into your usage with clear line graphs for Metrics and Events/Logs/Traces usage, allowing you to track trends and identify optimization opportunities. You can also view both weighted and unweighted usage for all resource types for a detailed breakdown.
- Partner-Level Tracking: If you are a partner managing multiple clients, you will appreciate the ability to track weighted and unweighted usage for each client individually, facilitating more accurate billing and client-specific optimization strategies.
![]() See Metered Usage Insights for more details.
See Metered Usage Insights for more details.
Availability Details:The availability scores color codes were updated to align with their respective state color codes in the UI. You can see the updated color codes in the Availability Summary sheet of the downloaded Excel sheet.
 |  |
See Availability Details for more details.
Software Inventory:A new dropdown field, Select Report Content, has been added, allowing you to generate more focused reports. The available options in the dropdown list are:
- Applications
- ServicesThis streamlines your data analysis by ensuring that your Excel reports contain only the specific information you need, providing a more efficient and user-friendly experience.
 See Software Inventory for more details.
Alert Listing:Additional attributes have been incorporated, enabling more detailed monitoring and management of alerts. The new attributes supported include:
- Elapsed Time
- Acknowledged Time
- Suppressed Time
- Ticketed Time
- Closed Time
- Created By

Alert Listing, Asset Inventory, and Process Definition Insights:Like other apps, list-based content data was removed from the UI, showing only the Summary and Glossary.
Core Platform
A new resource type UCS Rack Server is introduced for the resource Cisco UCS Rack Server. However, the resource type of already discovered rack servers remains unchanged even after re-discovery.
You need to use the following API to update the resource type:
POST {{localURL}}/api/v2/tenants/{{tenantId}}/resources/{{resourceUUID}}
Req Payload
{
   “resourceType”:“UCS Rack Server”
}

User Management
The following changes have been made in Two-factor registration process:
- You can now enable or disable two-factor authentication with a toggle button available on the top while editing the existing user
- Based on Organization preference, the two-factor authentication toggle button becomes mandatory.
- Administrators cannot activate two-factor authentication for other users for TOTP and DUO authentication.
Assign custom attribute to multiple resources
You can now assign a custom attribute to multiple resources at a time.

See Assign custom attribute for more details.
Integration name change
Linux OS - Agentless Integration under the OS category in the installed/available integration page is renamed to Linux OS - Agentless (SSH).This change is to convey that OpsRamp Gateway uses the SSH protocol to discover and monitor the resources.

SaaS Application
VeloCloud: Component relationship update
The resource relationships for VeloCloud Edge and Edge Links have been updated as follows:
- VeloCloud Edge is now configured as a componentOf Velo Edge Link
- VeloCloud Edge Link establishes a connectedTo relationship with Velo Edge.


Juniper Mist: New integration method
You can select the Username and Password option under Credential Type while adding a new Juniper Mist integration. This selection enables dynamic API key generation, thus mitigating rate limit issues and ensuring seamless interaction with Juniper Mist.

Log Management
Log Alert Definition Improvements
A new alert identification section has been added to the log alert definition page. This section allows you to define the scope of alerts and choose between Resource or Client entity types to specify alerts for specific resources or client-level alerts.This enhancement enables you to precisely define and categorize alerts based on entity type, attributes, components, and labels, enhancing overall log alerting efficiency.
 See Alerting based on Logs for more details.
Event Management
Enhanced alert browser column selection
You can now select additional columns such as acknowledgedTime, suppressedTime, ticketedTime, and closedTime from the alert browser column settings.Selected columns will display corresponding data, allowing you to access each alert’s information quickly.

Enhanced alert email notification template
Resource attribute basic information details including Resource Description, Resource Make, Resource Model, and Resource OS Name are now available as tokens for use in alert email notifications.You can leverage these resource attribute tokens to dynamically include essential details about the affected resources directly within alert notifications.
Public Cloud
Oracle Cloud Infrastructure (OCI)
You can now directly edit, manage, and unmanage OCI instances from the resource details page without navigating to different screens. This update allows you to make quick changes to your instances and easily adjust their management status.

Automatic removal of resources in AWS integration
When editing the AWS integration, users can choose whether to keep or remove agent-installed resources. If a user edits an instance of the integration and removes a resource type from being discovered, previously discovered resources of that type will now be automatically removed from OpsRamp.This enhancement ensures consistency in resource management by removing resources that no longer need to be discovered.
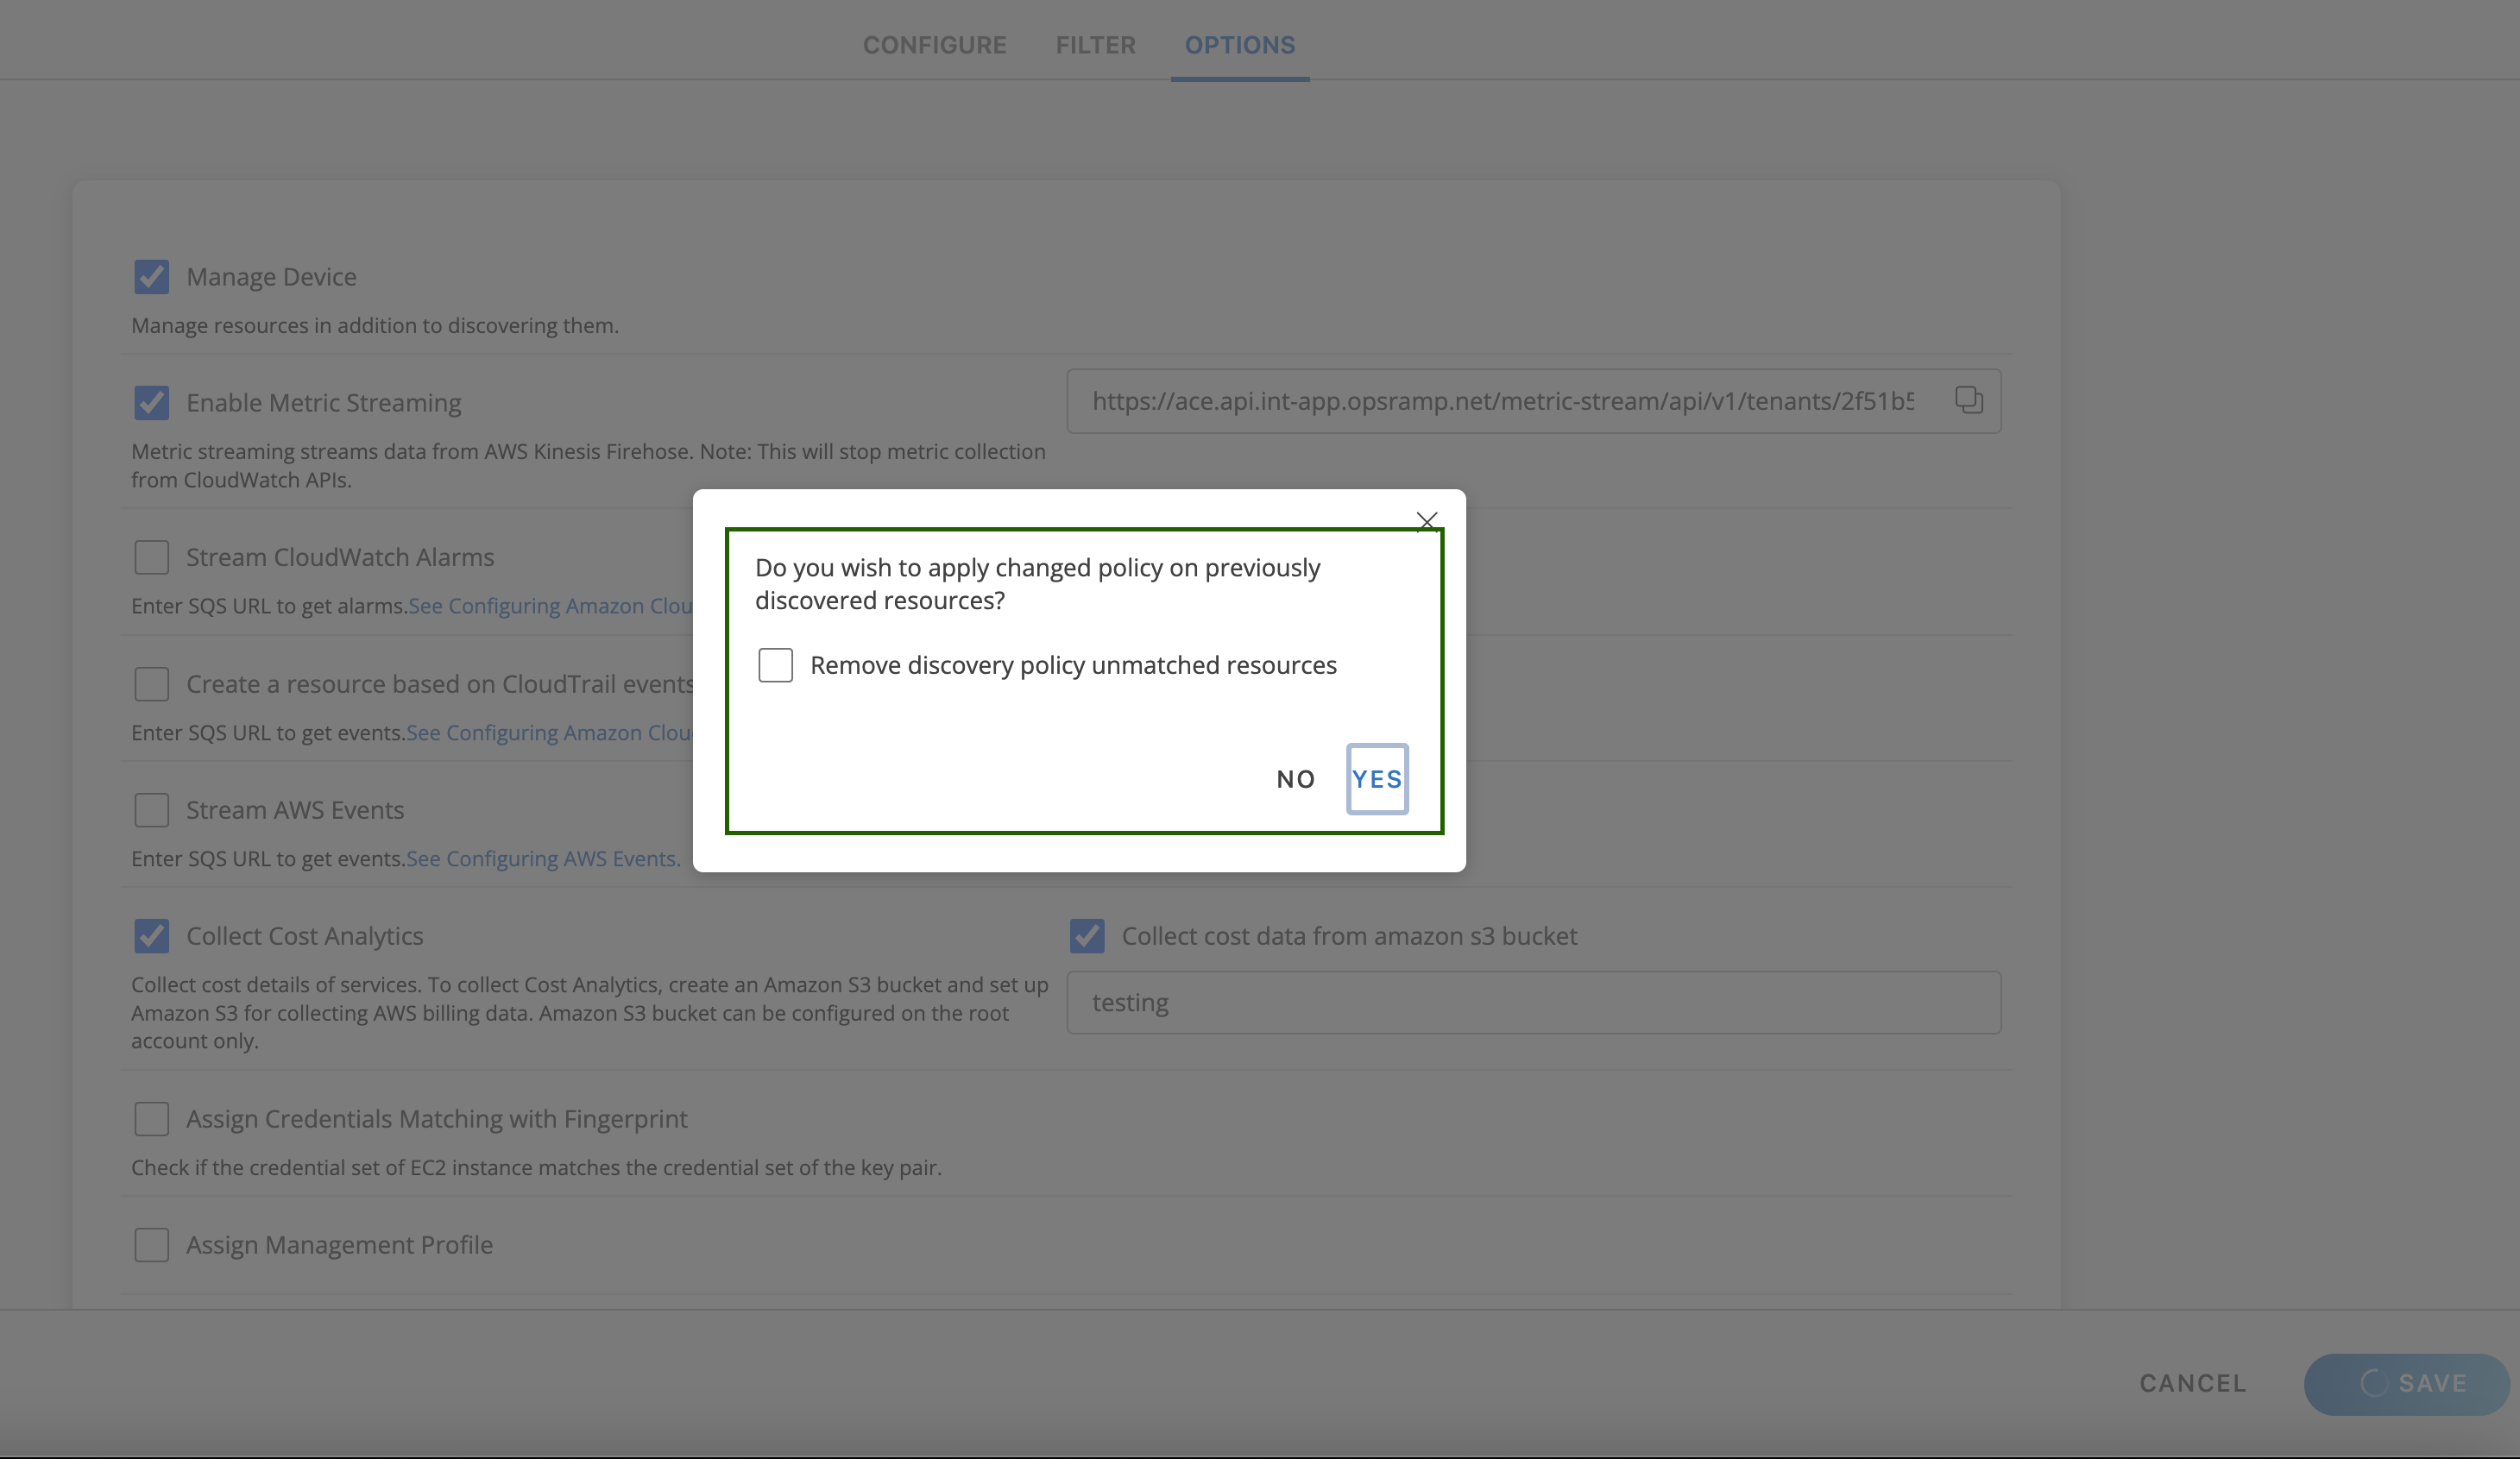
See AWS Integration for more details.
Updated method for AWS cost data collection
The AWS cost data collection now defaults to utilizing the Cost Explorer APIs instead of the S3 Bucket method. This update ensures the use of the latest and up-to-date method for retrieving cost data from AWS.The users who prefer to continue using the S3 bucket method for cost collection need to select the Collect cost data from Amazon S3 bucket option during integration.

Discover HA VPN gateways from Google Cloud Platform (GCP)
The HA VPN gateway from GCP are now discoverable, like classic gateways. Using the API, you can query HA VPN gateways and visualize them within the user interface (UI).
API Enhancements
Enhanced scope query parameter support for v2 Search Template API
The scope query parameter of v2 Search Templates API is not filtering as per the scope, and a few scope parameters are not working. Fixed the same.
Reporting API get/run is not considering the runs created by UI
The GET Runs Reporting API is enhanced to support runs created by UI as well. For further details please refer to API documentation.
Updates in upcoming releases
Movements
Starting from July 2024, the Setup > Exports feature will be moved to Setup > Account > Integrations under the Exports category.
Deprecations
The following deprecations will be effective starting from July 2024:
Tenant Management
The following fields are being removed from the Add, View, and Edit Partner workflow as part of new UI changes:
- Partner details tab
- Phone number
- Mobile number
- Contact name
- Advanced Settings tab
- Channel and Escalation Status dropdown lists.
Agent Policies section is being removed from the Add, View, and Edit Client workflow as part of new UI changes.
User Management
- Business Essentials user option is being deprecated from the Account Type section from Add User workflow. You will be able to view only Regular user and Business user options.
- U2F two-factor authentication will be deprecated in the edit user workflow. If you have already enabled U2F authentication for any user, it will be reset to the initial state. You can then select from the remaining options available: TOTP, DUO and YUBICO.
Week of April 30, 2024 (2024.04-U1)
Click here to view 2024.04-U1 Release Notes
User Interface Enhancements
Dashboards
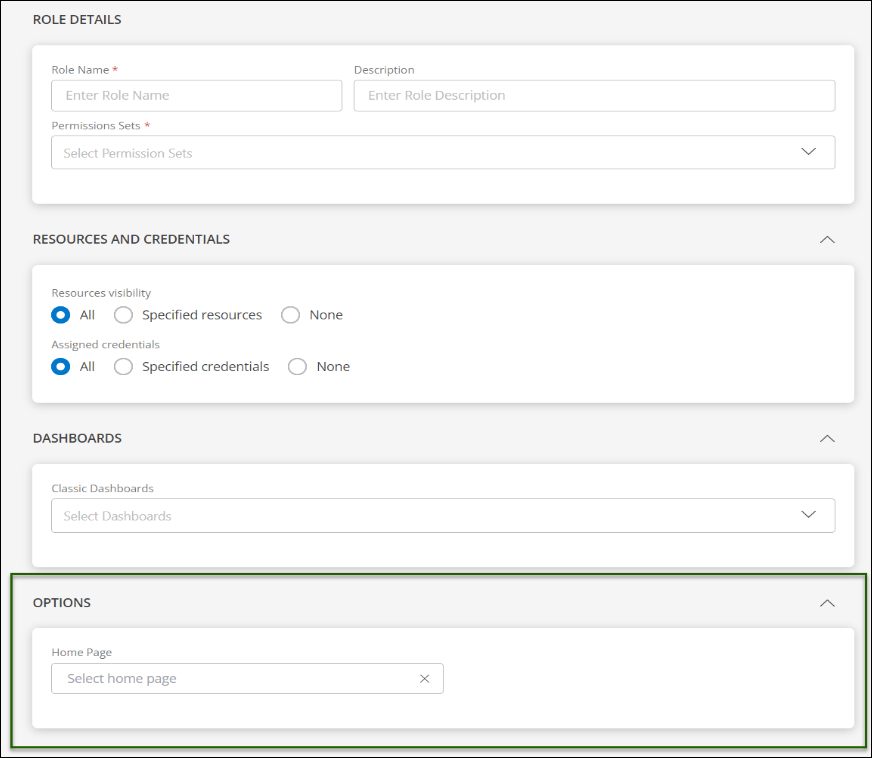
Role-based default landing pageYou can now set the landing page according to your role. Your landing page will be tailored specifically to your role, providing a more personalized experience.
Tenancy and RBAC
Two-factor lookup
The Two-Factor lookup feature has been added to Setup > Account > Users and Permissions > Users > Lookup Two-Factor Key.

Integrations
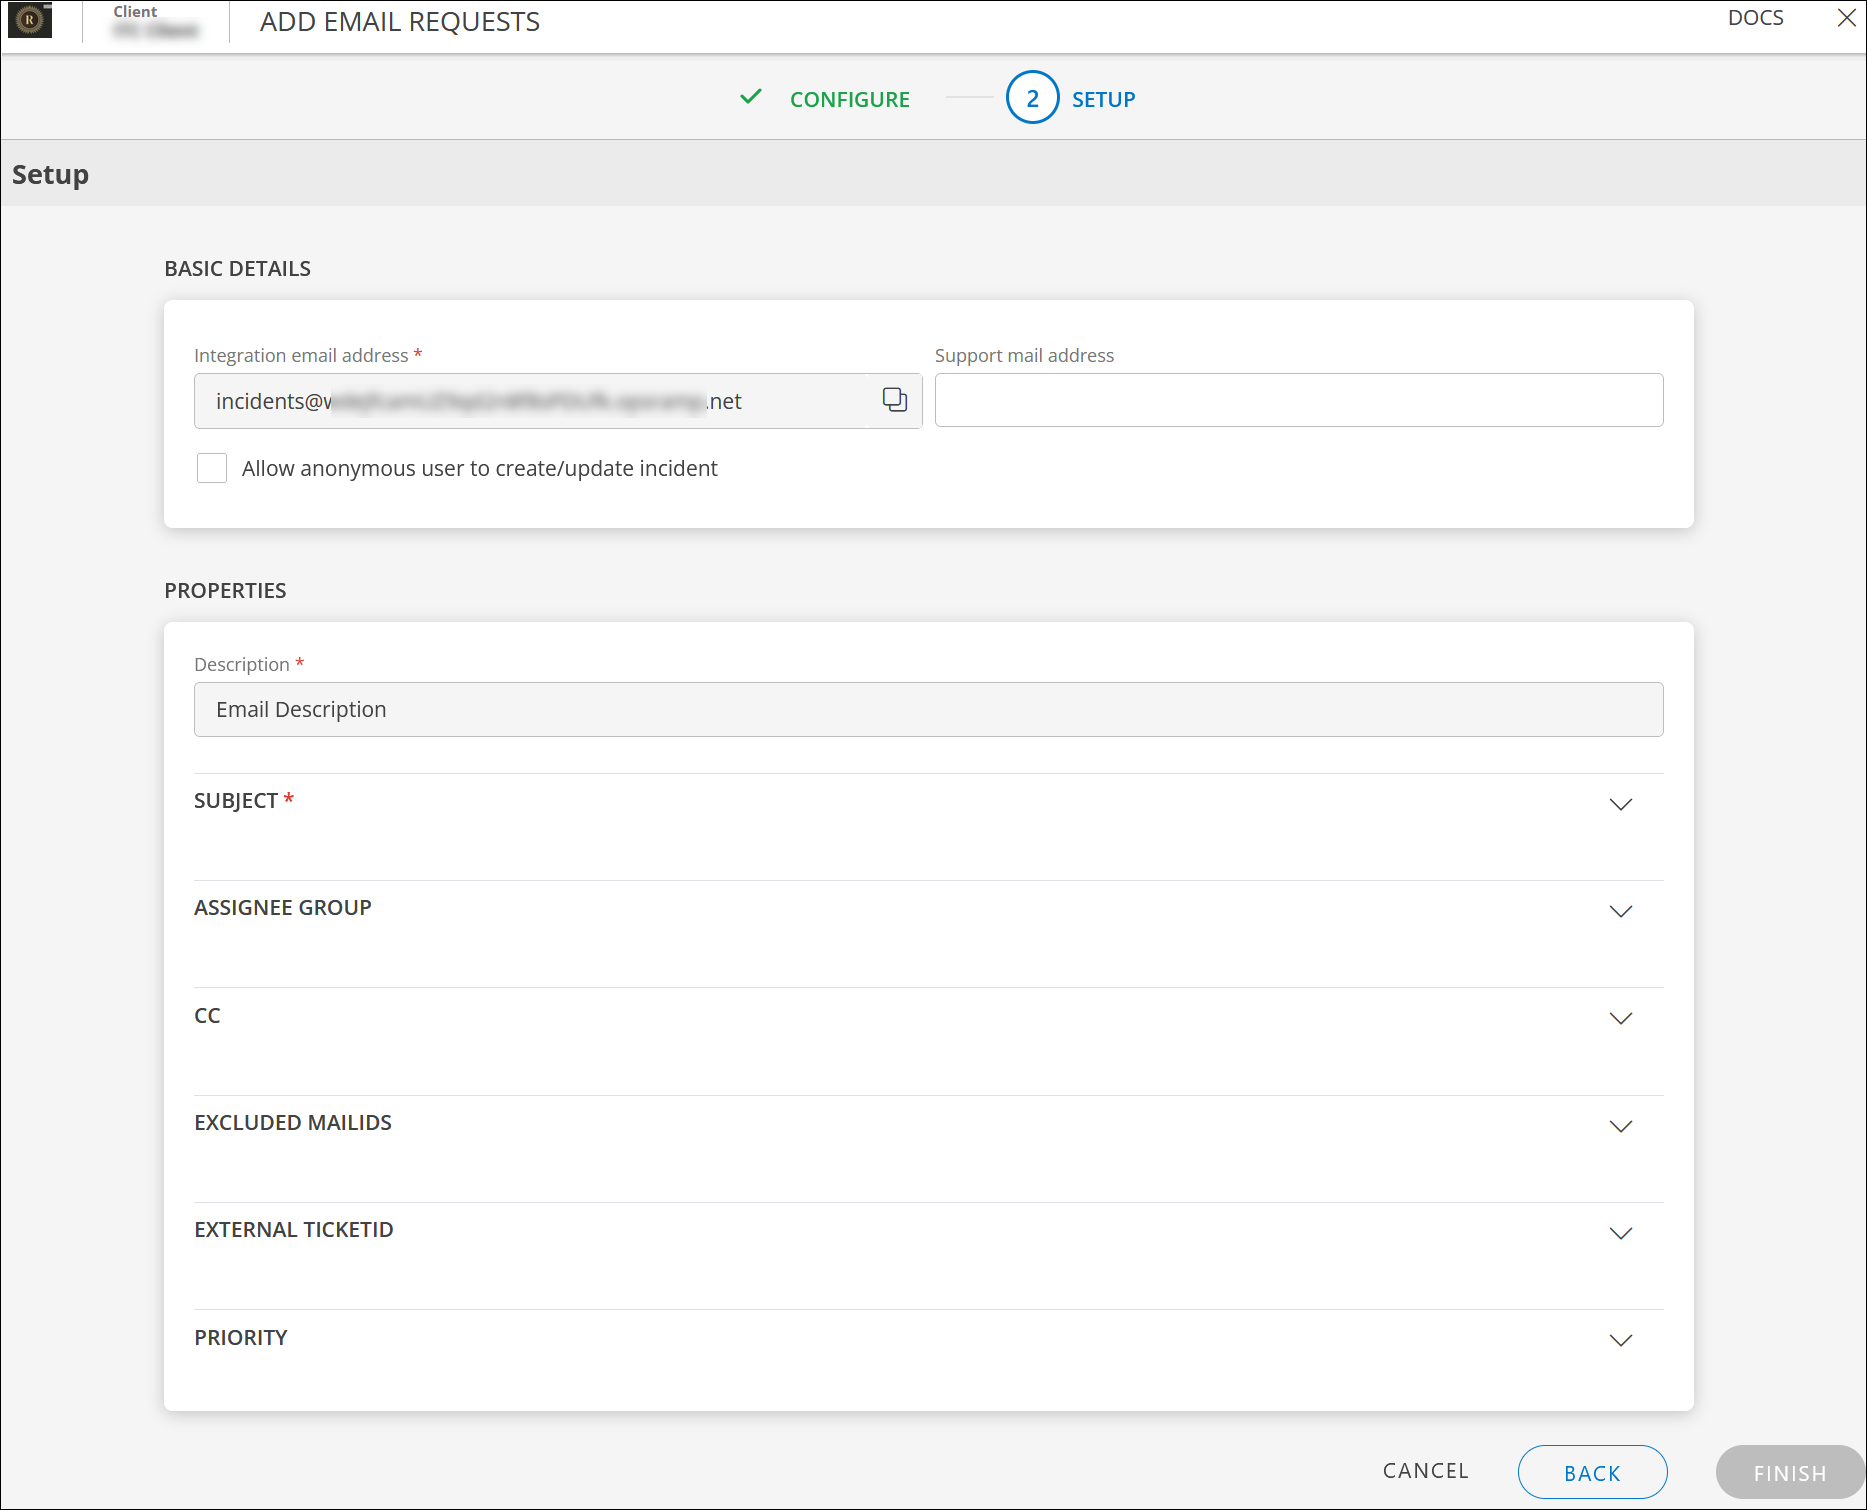
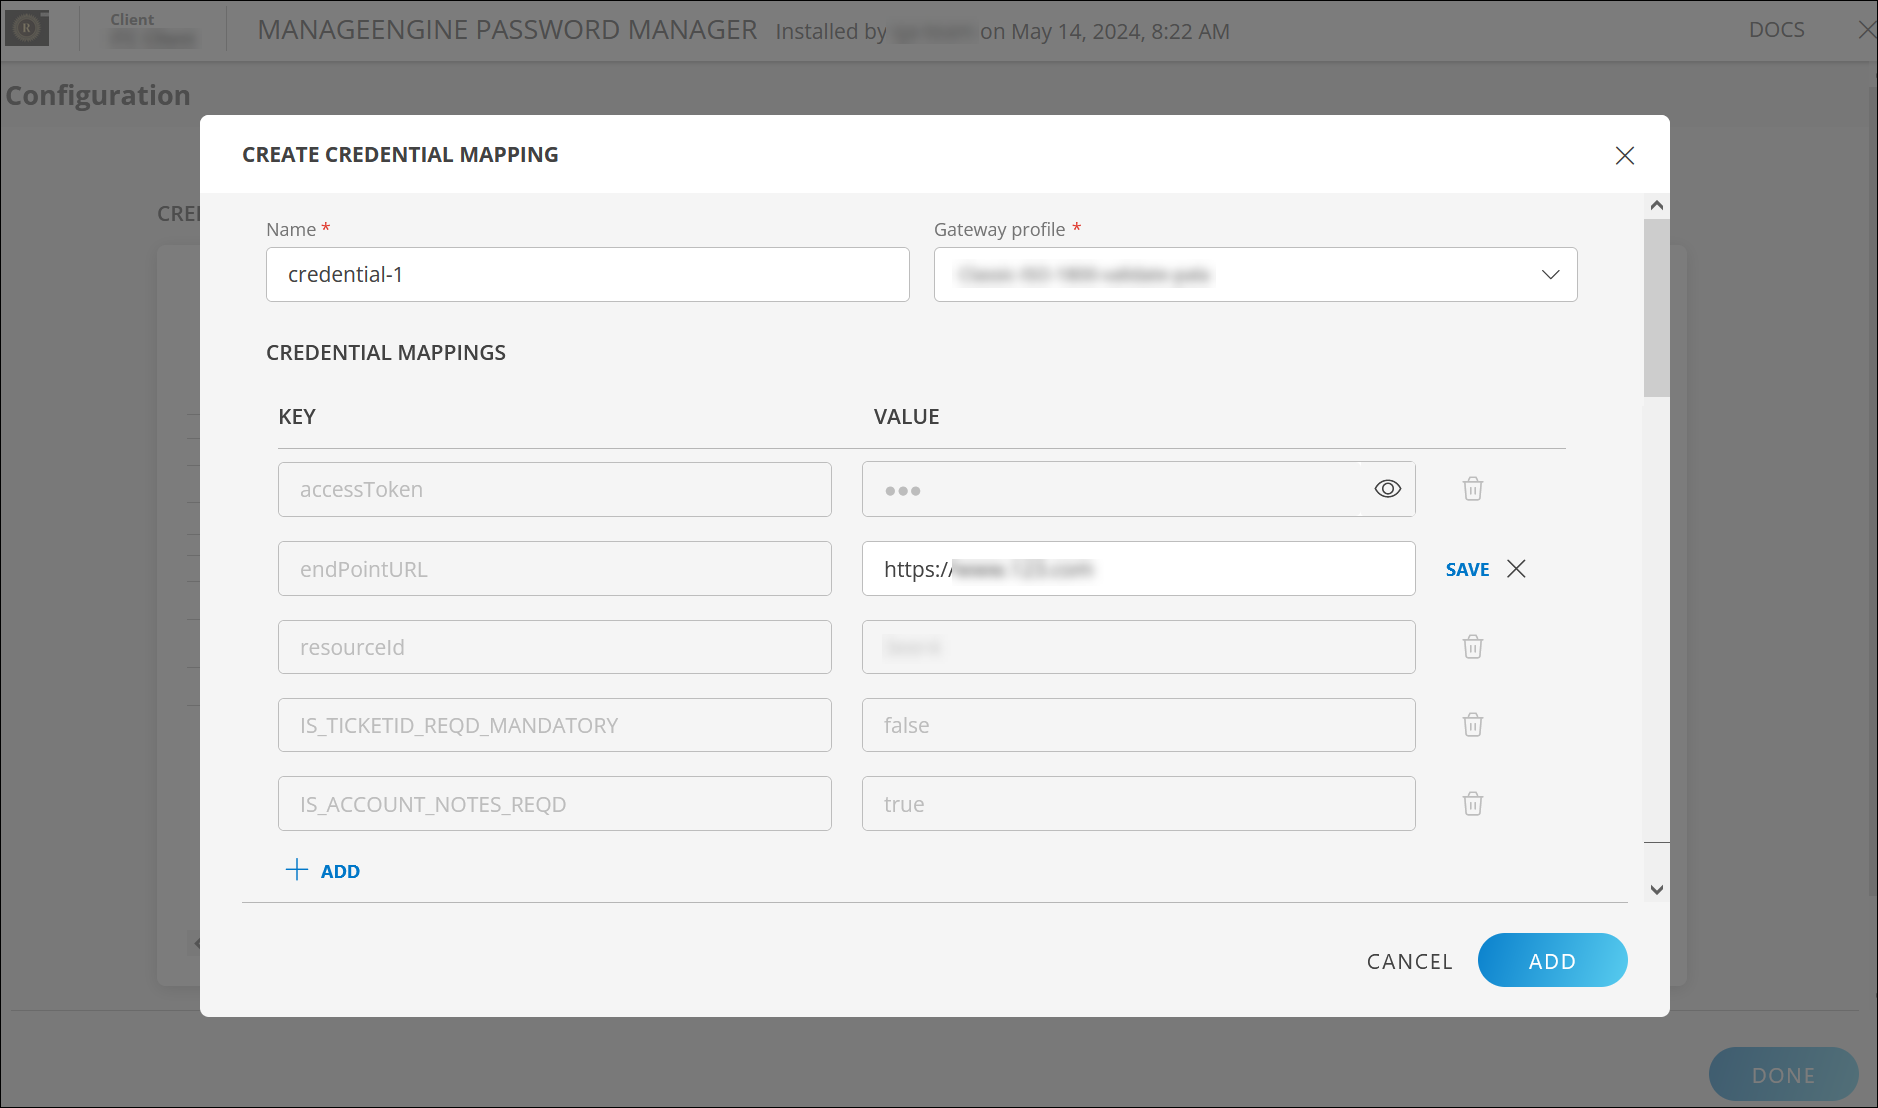
Improved UI for Email Requests and Password Management
Email Requests and ManageEngine Password Manager integrations have an enhanced UI for better user experience and easy accessibility.
Email Requests Integration:
ManageEngine Password Manager Integration:
Dashboard
Enhancements
Improved data points selection in line graphs
You can select specific data points within the line graph visualization. This enhancement allows for more precise analysis and interaction with the data presented in the graph.
Note: Press Ctrl + Click to select multiple data points.
Monitoring Management
New Feature
Enhanced integration management
You can now switch the gateway collector of your installed integration to a different gateway to manage or distribute the load of an overloaded gateway by editing the configuration within each installed integration. This enhances the monitoring capabilities.
Changing the gateway collector will now switch discovery and monitoring configurations to the newly mapped gateway, automatically removing configurations from the previous gateway.
Known Issue: If you have configured network configuration backup jobs and have migrated all SNMP discovery configurations from one gateway to another, the network configuration backup jobs will be created on the new gateway, but some jobs will remain on the old gateway. This is a known issue that will be fixed in gateway version 17.2.0.
Reporting Apps
New Features
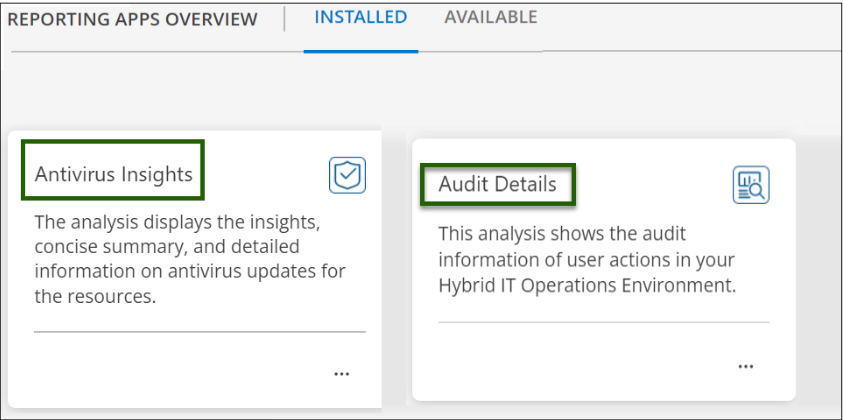
Added the following widgets to the Reporting Apps:
Antivirus Insights: The analysis report displays updated trends and insights of the antivirus, including antivirus updates, status, and schedule details for the resources.
Audit Details: Offers valuable insights into user and API activities within your IT infrastructure. The analysis report gives you a comprehensive overview of operations performed on resources, groups, service groups, and so on, enhancing your understanding of user activities in your Hybrid IT Operations Environment.
Patch Management
New Feature
Patch Baseline support in Patch 2.0
Baseline support is available in Patch 2.0, enhancing your patch management capabilities.
This support extends to Patch Configuration and Patch Compliance as follows:
When you select the baseline option in Patch Configuration, all the missing patches specified in the baseline will be installed on the selected devices.
When you select the baseline option in Patch Compliance, the system computes and presents the counts for compliant, non-compliant, and not applicable devices against each baseline.
See Patch Baseline for more information.
Log Management
Enhancements
Enhanced Logs Explorer search filters
You can now send desired attributes from Fluent-bit and FluentD integrations to add them to the search filters on the Logs Explorer screen. This enables you to find relevant log data quickly.
OpenTelemetry (OTEL) integration
The Open Telemetry integration enables you to deploy and configure the OTEL collector directly from the OTEL collector contrib repository and pre-configure the collector to gather metrics, logs, and traces using the Helm Chart. This simplifies the deployment process for new Kubernetes cluster users who want to commence monitoring using the OTEL collector without relying on the OpsRamp agent.
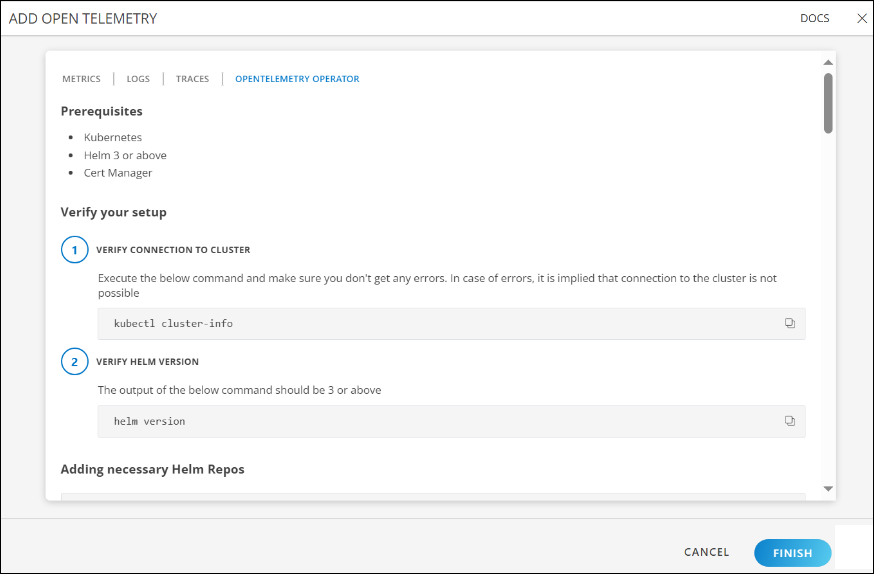
Event Management
Enhancements
- Added the Update Inference Criteria field to Alert Correlation Policies. It allows you to modify existing inferences based on the specific criteria. When the first correlated alert triggers, it becomes the inference alert. Any subsequent alerts matching the criteria are added to this inference alert.
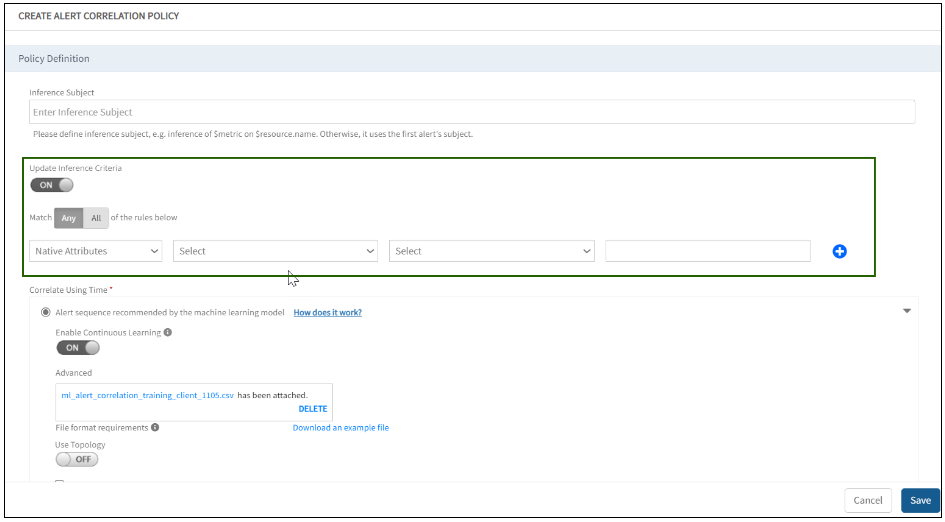
The comments section displays the user details of the last acknowledged user. You can add comments to an existing acknowledged alert.
You can view and manage incidents directly from the incident ID column of an associated alert.
If the corresponding alert priority changes, the incident priority is automatically updated based on the priority defined in the ML training file.
Tracing
Enhancements
You can now customize multi-column support in Trace Explorer by including or excluding predefined trace attributes as columns for the Root Spans and All Spans tables.
Public Cloud
Enhancements
Reduced alert noise for Meraki Integration
Meraki Integration now delivers pre-configured alerts specifically for credential errors, such as invalid credentials. You will no longer receive alerts generated for other scenarios, such as discovery and monitoring issues.
Introduced load balancer backend set in Oracle Cloud integration
Oracle Cloud Integration (OCI) load balancer backend set resources support discovery and monitoring now. Monitoring templates are available for metric collection, and alerts will be generated based on the preset thresholds in the templates.
Week of March 29, 2024 (2024.03-U1)
Click here to view 2024.03-U1 Release Notes
UI Enhancements
Collector Profile
The Collector Profiles card has been introduced within the Setup > Account section as a replacement for the former Setup > Resources > Management Profiles feature.
The card displays the gateway-based collector profiles for the client, providing the necessary information and configuration of the Management Profiles page.

See Collector Profiles for more details.
Dashboard 2.0 Enhancements
Option to create Public Dashboard
A private dashboard or a shared dashboard can be transformed to a Public Dashboards. These dashboards can be shared with all users within the tenant irrespective of their roles. When a Dashboard within a tenancy is shared with “All Users”, it automatically transforms into a Public Dashboard.
Note
Users must have Dashboard Management Permissions to create a dashboard.
See Dashboard Operations for more details.
Visualize real time status in Geo Map type
The Geo-Map visualization has been enhanced to give users a better understanding about site activity across geographic regions. These markers reflect either the Alert State or Resource Availability.
Below are a few color-coded markers that indicate the status of the site resource:
- Red: Sites with resource downtime or at least one critical alert on resource are marked in red.
- Yellow: Sites with warning alert on resource are marked with yellow.

See Geomap for more details.
Dashboard tiles with 15-Day time period
Added “Last 15 Days” option to both dashboard and tile time range settings. Select this option for the widget to display data from the last 15 days starting from the current time.

See Dashboard Operations for more details.
Resource group filter in schedule maintenance tile
The schedule maintenance tile has been enhanced to allow filtering based on Resource Groups. Users can now view the list of schedule maintenance for a selected set of resource groups.

See Schedule Tile for more details.
Increased limit in Honeycomb visualization
The honeycomb list limit has been extended to 100 resources. Users can now visualize their data by zooming in and zooming out of the window.

Enable room mode in dashboard
User now have an option to configure room mode in their dashboards, enabling auto-play of all dashboards within the collection.

See Dashboard Operations for more details.
Agent Enhancement
Removed sensitive information from Agent Deployment Scripts
Due to security reasons, we have decided to remove the auto-populating sensitive information from Agent deployment script (deployAgent.py), shell script (deployAgent.sh) and Ansible script. Instead, customers can provide the necessary command-line arguments to the scripts to install the Agents.
Detailed information of these arguments is available on the Agent download instructions page.
Gateway Enhancement
Support of additional gateway commands execution via Agent
Provided support for the additional gateway commands execution to enhance its capabilities. These commands are accessible only to service provider users and gateway devices.
To access these commands, contact our support team and request them to enable the “enable_gateway_cmd_via_agent” flag.
See Supported Remote Commands for more details.
Tracing enhancements
Tracing UI enhancements
- The default launch page for traces has been changed to the “Service” insights page, providing easier access to tracing insights. The “Trace Explorer” page can still be accessed via quick links in the menu.
- Apdex (Application Performance Index) scores have been introduced in service insights and all tabular views, offering valuable tracing insights into applications, services, and operations.
- A new tabular view called “All Spans” has been added to the Trace explorer page. This view allows users to see all spans, including child spans, based on the query filter provided.
- The list of top 20 operations on the Service Insights page is now clickable. Clicking on each operation redirects users to the operation overview page for more detailed information.
Support multiple proxy for Tracing Proxy
Added support for multiple proxy server’s configuration in Tracing proxy (OpsRamp traces collector). This will allow users to route the traffic to OpsRamp.
Event Management Enhancements
New Alert browser to show more alerts
The new Alert Browser has been optimized to display more alerts within the window, reducing empty spaces and providing users with more alert information.
Provided Heal option for correlated alert
Users can now heal the Correlated alerts that are in Warning and Critical states by selecting the Heal option. After the Heal action is performed on individual alert, users will no longer see the healed alert in the Alert Browser.

Capture process automation details in alert
When a user creates or updates an OpsRamp process automation workflow, these actions are now logged in the alert comments. This will help users to track which workflow made the changes with all necessary details.

Alert 2.0 Enhancements
Alert Definitions Page under Setup
Alert Definitions link will be moved from Setup > Monitoring and it will be available under Setup > Accounts effective from April 2024.
Resource Management Enhancements
Option to select multiple credentials in a single action
Users can now assign multiple credentials (up to 5) to single or multiple resources. Previously, users could assign only a single credential to single or multiple resources.
See Assign a credential for more details
Public Cloud Enhancements
Support of AWS Dynamo metrics
Following AWS DynamoDB metrics are supported additionally now:
- AccountProvisionedReadCapacityUtilization
- AccountProvisionedWriteCapacityUtilization.
Log Backup Storage Size metrics
Azure SQL Database has been enhanced to support Log Backup Storage size metrics.
Support of additional metrics for application gateway in Azure
Added new metrics for Application Gateway in Azure:
- WAF Managed Rule Matches
- WAF Custom Rule Matches
- WAF Bot Protection Matches
Azure Front Door CDN metrics support
We now supports metrics for Azure Front Door CDN.
Reporting Apps Enhancements
Tenant Details Application
Introduced a new application named “Tenant Details” which provides tenants details. Users can now get both partner and client details based on their configuration while generating reports.

See Tenant Details for more details.
User Details Application
Introduced a new application named “User Details”, which provides user details associated with OpsRamp account. This application will help users to generate detailed reports of their organization’s users which are associated with OpsRamp account.

See User Details for more details.
Schedule Maintenance Insights Application
Introduced a new application named “Schedule Maintenance Insight”, which provides the following information while generating the report:
- Shows details of configured Schedule Maintenance windows.
- Breakdown of schedule maintenances by status.
- Breakdown of schedule maintenances status by tenant.

See Schedule Maintenance Insight for more details.
Availability Details App Improvements
The Availability Details app now supports additional attributes such as Latency and SSL information for Synthetic resources.
This enhancement enables users to filter Synthetics by type, name, or URL and view additional columns such as Latency and Certificate Expiry (Days) alongside availability scores.
Integration Framework Enhancements
UI transformation for Events, SSO, Automation integrations
Transitioned all integrations related to the Events, SSO, and Automation category to a new UI. However, the “Email Alerts” integration remains unchanged.
Integration activity log support for users
If API access is enabled for a user, the Administrator can view the logs of the API by selecting the “View Logs” option linked to their user account. This feature allows users to track the API URLs accessed using the key secrets associated with their account.


See Actions on a user for more details.
ServiceNow-OpsRamp certification with Washington version
The OpsRamp-ServiceNow integration is certified to support the latest ServiceNow version, Washington DC. The prior versions (Vancouver, Utah, and Tokyo) are also supported.
See ServiceNow - ServiceNow Store Method for more details.
Bug Fixes
The issue has been resolved where all critical tickets are displayed in the critical section of Topology side panel. Now, the “suppressed” and “correlated” tickets are excluded from the critical section as expected.
Week of February 27, 2024 (2024.02-U1)
Click here to view 2024.02-U1 Release Notes
UI Enhancements
Extended Support to Share Dashboard 2.0
The Dashboard 2.0 sharing model has been improved to be consistent with Tenancy context. A tenant user can share dashboard to tenant user roles or their client user roles. A client tenant user can share with their defined user roles only.
Note: When selecting the Partner, you can view both the Partner and Client Roles.
Client Roles:
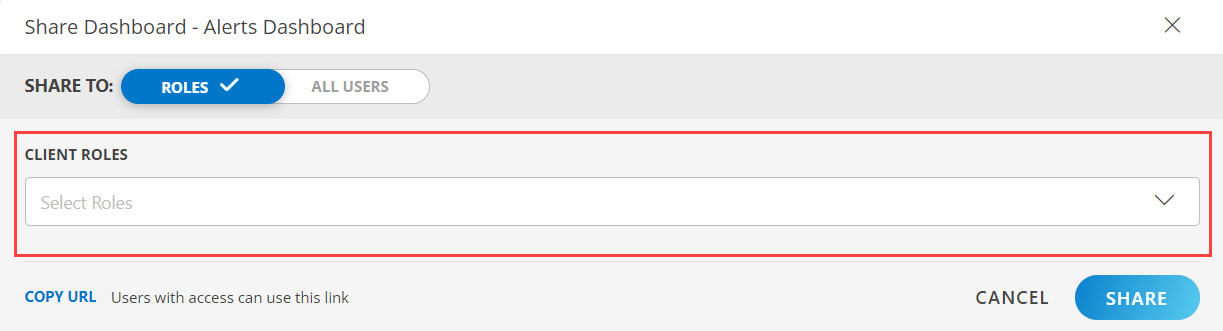
Partner Roles:
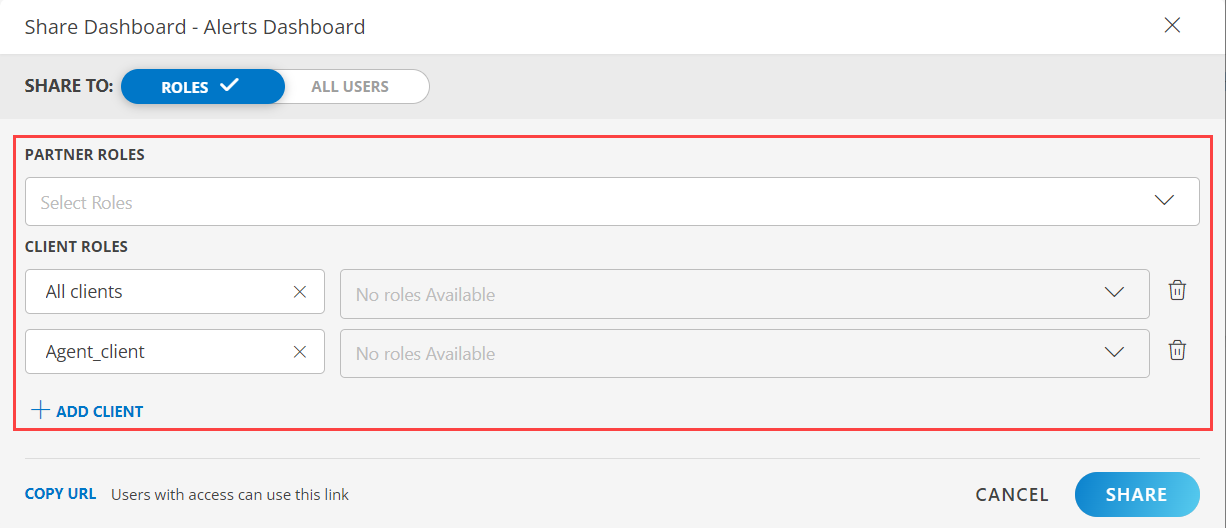
See Share and Unshare for more details.
Reset Password via Invite User Flow
Users who are invited through OpsRamp Portal will receive an email link to reset their password.

See Create a user for more details.
Group Resources by Metric Values (CPU, Memory, Storage)
From the Infrastructure > Search > Home tab, you can now view the Top 50 and Bottom 50 resources that are utilizing the CPU, Memory, and Disk based on the Metric value.

See Infrastructure Search for more details.
Transition to New Groups and Sites Page
The “Groups” and “Sites” link under Infrastructure will now redirect users to the Infrastructure > Search home page.
Note: The “Groups” and “Sites” links under the Setup page have been deprecated.

New Groups Page
Click here to view the New Groups Page changes
Transformation of Group Add Page
With the current release, the Group Add page is being transformed as below:

Enhanced Member Matching in Group Creation
Display matching members during Group Creation is transformed as follows:

Enhanced Group Listing Page
You can now navigate to groups from Infrastructure > Groups

Restructuring of Partner-Level Groups
Reorganization of Partner-Level Groups
Partner-level groups have been relocated from Setup > Resources to Infrastructure > Groups. Based on the tenant context, groups can now be added here:
We are migrating all existing groups as part of this transformation into a query.
For example, if we previously had any filters as follows:

They will be transformed into OPSQL format as shown below:

Some other examples of how queries can be used:
- With tags

- With ResourceType

The following attributes are no longer supported as part of this transformation:
- Azure Resource Group Name
New Sites Page
Click here to view the Sites Page changes
Transformation of Sites Add Page
With the current release, the Sites Add page is being transformed as below:

Enhanced Member Matching in Sites Creation
Display matching members during Sites Creation is transformed as follows:

Enhanced Sites Listing Page
You can now navigate to groups from Infrastructure > Sites

Restructuring of Partner-Level Sites
Reorganization of Partner-Level Sites
Partner-level sites have been relocated from Setup > Resources to Infrastructure > Sites. Based on the tenant context, sites can now be added here:
We are migrating all existing sites as part of this transformation into a query.
For example, if we previously had any filters as follows:
They will be transformed into OPSQL format as shown below:
Some other examples of how queries can be used:
- With tags
- With ResourceType
The following attributes are no longer supported as part of this transformation:
- Azure Resource Group Name
Direct Access URL for Views
Users can now copy the direct access URL for a specific view.
Note: With this enhancement, users can conveniently copy the URL of any view across various screens, including Alert, Resource, Logs, Traces, and Tickets.

See Managing views for more details.
Scheduled Maintenance Card
As part of the current release, we have introduced the “Schedule Maintenance” card, now accessible under the Setup > Accounts page. This new feature allows users to conveniently view and manage maintenance schedules for their clients.
In the new schedule maintenance page, we have implemented changes to enhance usability and streamline scheduling processes.
Note: We have dropped support for scheduling maintenance for more than one day within a month in the same schedule.

See Scheduled Maintenance for more details.
Mandatory Agreement to Terms of Use
With the current release, it is mandatory for all customers to agree to the HPE Terms of Use while registering for the application.

Dashboard 2.0 Enhancements
Enhanced Existing Tile Gallery
Users now have access to a curated selection of tiles that mirror classic widgets, streamlining the task of duplicating and generating classic-equivalent Dashboards 2.0. This enhancement is designed to promote the adoption of Dashboard 2.0 among users.

See Introduction to Tiles for more details.
New Scheduled Maintenance Tile
Users can now visualize schedule maintenance information via the “Schedule Tile.” This enables users to view both ongoing scheduled maintenance and access upcoming scheduled maintenance windows.

See Schedule Tile for more details.
Title Addition for Single Value Tile
You can now add a title to the Single Value, making it easier to identify and understand.
For example, if you add a header as “Count,” you can customize the color, alignment, and size of the title to suit your preferences.
Note: This feature is applicable for Metric, Alert, Resource, and Ticket tiles, providing greater flexibility and customization options for your dashboard.

See Introduction to Tiles for more details.
Added Multiple Metric Value Utilization
With the current release, users can now incorporate multiple Metric Values, labels, and consistent headings within the Single Value visualizations featured in the Metric Tile.
Previously, the system allowed for only a single query for Single Value representation.
Note: After three queries, users will no longer be able to create additional ones.
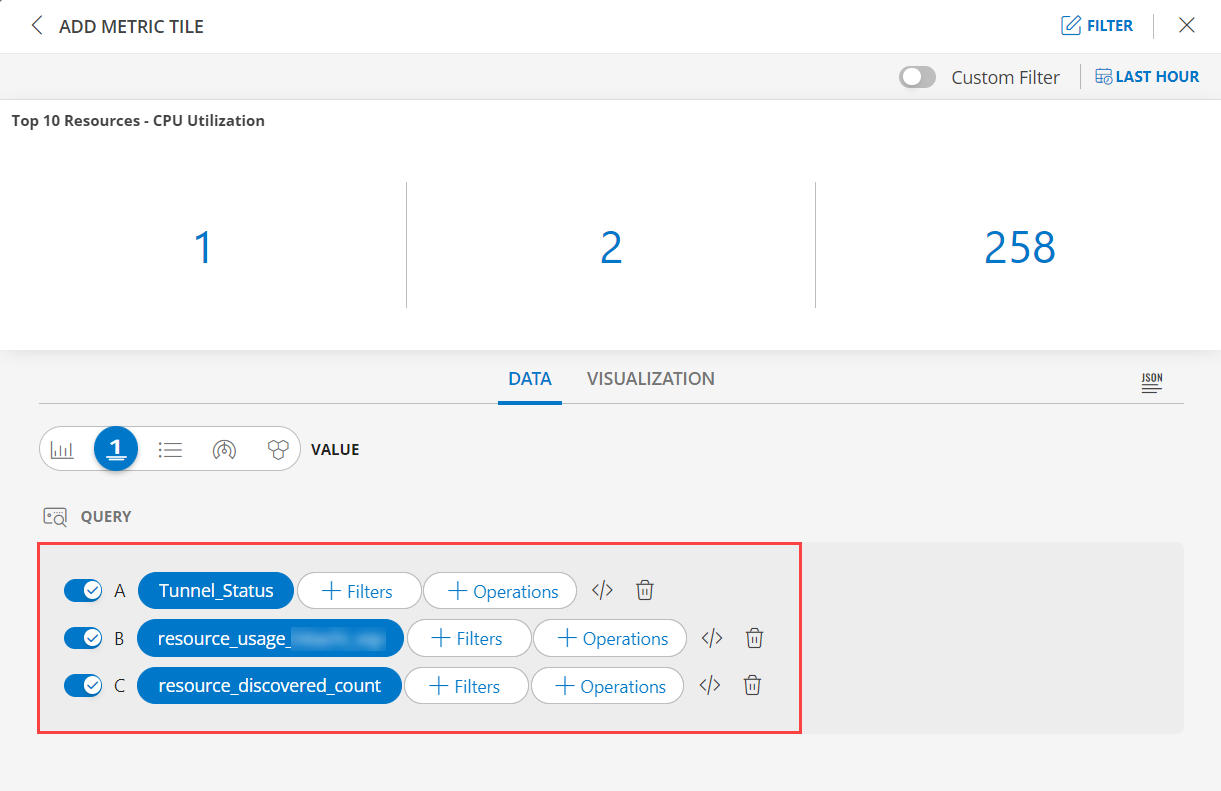
See Metric Tile for more details.
Sort Property for Any Tile Type
In Tile preview mode, we have implemented a new functionality where any changes made to the sorting of a column by clicking on the table will now be persisted. This means that the sort order selected during preview mode will replace the sort option previously available in the visualization tab.
Note: This feature is available for Metric, Alert, Resource, Ticket tile.

Option to Export Classic Dashboard to Dashboard - 2.0
Users can now export a “Classic Dashboard'” as a Dashboard 2.0 JSON file using the Export as Dashboard 2.0 option. This allows users to manually import the JSON file and visualize the equivalent Dashboard 2.0.
Note: This feature is currently available in beta version.
Beta release Limitations:
- Dashboards existing sharing configuration is not supported. User needs to re-share again.
- Color visualization is with default colors.
- All the EOL classic widgets will not be part of conversion.
- Image widget conversion is currently not supported and will get added later.
- Patch Compliance and Cloud Insights deprecated Widgets are also not part of conversion.

Service Tile Availability Details for Partner Tenancy
Users can now visualize availability information of specific services across clients at the Partner Tenancy.

See Service Tile for more details.
Included Downtime Column in Service Tile
Customers now have the option to include a downtime column in the Service tile. Upon hovering, users can also view a breakdown of the downtime.

See Service Tile for more details.
Usability Improvements in Tiles
Classic widgets mentioned have been removed from the Y-axis for non-metric tiles. The Scale representation has been improved to display whole numbers. Additionally, total count has been added to the doughnut visualization type, enhancing usability and alignment with classic widgets.

Service Map Nodes Enhancement
Service Map Nodes are now tagged with the parent/root node of the service map. This enhancement is designed to assist users in uniquely identifying parent service within the Service Availability widget in Dashboard 2.0.

See Service Tile for more details.
Patch Visualization using Resource Tile
Patch related visualization can now be achieved using resource tile.
With this update, OpsQL will now support patch-related attributes such as missingPatchCount, installedPatchCount, failedPatchCount, and approvedPatchCount as response payload attributes for the resource objects.
SaaS Monitoring Enhancements
Cradlepoint Integration Enhancement
The Cradlepoint integration can now only be installed once per client. The system no longer allows the installation of duplicate integrations.
Monitoring Management Enhancements
Push Changes in the Monitor to Associated Templates
Users now have the option to save the recent changes to associated templates. Upon updating metrics or configuration parameters, an option to save the recent changes to the associated templates is provided.
A popup will prompt users to select and push the changes to the templates, which will subsequently be re-assigned to all affected resources. Alternatively, users can choose to save the monitor changes without selecting templates in the popup, preserving changes solely within the monitor.
Previously, users were required to manually navigate to each associated template, edit, and re-add the monitor to reflect changes.

See Edit a Monitor for more details.
Switch Gateway in the Discovery Settings
Users now have the option to change the gateway and map the discovery and monitoring configuration to a different gateway.
This enhancement will help users to effectively manage or distribute the load from an overloaded gateway to a new gateway or a less overloaded gateway, thereby improving monitoring capabilities.
Previously, when changing the gateway management profile in integrations/apps from gateway#1 to gateway#2, the discovery was mapped to gateway#2 while monitoring remained mapped to gateway#1.
With this update, changing the gateway profile ensures that both discovery and monitoring are switched to the newly mapped gateway, removing them from the previous gateway. This streamlined approach simplifies gateway management and enhances monitoring efficiency.
Validate Button for Expression Error
The Validate button now allows users to check for errors in your expression directly within the creation process.
With this enhancement, you can now verify the accuracy of your expression in real-time while creating a monitor. If any errors are detected, users will have the opportunity to correct the expression on the spot, ensuring that their monitoring setup is accurate and error-free.

Detaching Gateway Alert Enhancement
When you detach the gateway, OpsRamp will generate a critical gateway deregister alert within the client scope. This alert is not mapped to the gateway resource, and you will need to locate these alerts in the alert browser.
Note: Prior to this change, the deregister alert was mapped to the gateway resource.
Metrics Engine Enhancements
Audit for Alert Definition CRUD Operations
Audit data related to the creation, updating, and deletion of Alert definitions is now accessible to users.
Reports/Reporting Apps Enhancements
Login Activity Application
The application displays user login activity, encompassing user details, login and logout statuses, and its duration.

See Login Activity for more details.
Network Backup Insights Application
OpsRamp has introduced a new application named “Network Backup Insight”, this application provides insights into devices configured for network backup.
Users can now view the latest backup details of configured network backup devices, including the status of configuration changes, success, or failure of the backup process.

See Network Backup Insights Application for more details.
Availability Details Application
OpsRamp has introduced a new application named “Availability Details”. This application will provide you with a summary of the availability or detailed outages of resources, service groups, and synthetics over a certain period.

See Availability Details Application for more details.
Support of Custom Attributes (Tags) in Reporting Apps
In the configuration parameters section of Reporting Apps, users can now find a dropdown labeled “Select Tag Name,” which lists all available tag names. Each tag name is selectable and displayed as an individual column, providing the corresponding tag value in the Reporting Apps.
Additional Attributes Support in Asset Inventory Application
We have included additional resource attributes in the asset inventory applications. Users can now filter specific resources using these attributes in the OpsQL query filter.
Default Attributes Added to Ticket Details Application
We have integrated certain ticket attributes into the ticket details application. Users can now filter specific tickets using the available attributes in the OpsQL query filter.
Addition of Client Name to Report Output Filename
The tenant’s name is now incorporated into the Reporting Apps file name. It is simplifying identification by associating the report file name with the respective tenant.
Improvements in Metered Usage Insights Application
We have incorporated all resource types belonging to the tenant and their respective weighted usages into the metered usage application. Users can now identify the usage for each resource type.
Export Enhancements
Batch Export support at client scope
The Batch Export feature is now available at the client scope, enabling users to utilize this functionality directly at the client level. The clients should install supported export integrations to export the data to specific storage accounts.
See Setup Batch Export for more details.
Event Management Enhancements
Extended Learning Period and Alert Generation Conditions for Change Detection
The learning duration for change detection through alert definitions can now be configured up to 30 days.
Time-based correlation extended from 30 minutes to 4 hours
Users can now select a time window of up to 4 hours in alert correlation policies.
Extended Suppression Policy Duration to Over 24 Hours
We have extended the duration options for the First Response Policy “Suppress Alerts” feature to over 24 Hours, which include 4 hours, 6 hours, 8 hours, 48 hours, and 72 hours.
Notification Customization and Package Subscription
The Alert Notification customization screen (accessible through all screens under Setup > Notifications > Alerts) will now be exclusively available to users with an Event and Incident Management package subscription.
Public Cloud Enhancements
Operational Insights Metrics from Azure We now support metrics from Azure Operational Insights; consistent with information provided in the Azure documentation.
API Management Service - Network Connectivity Status of Resources
OpsRamp now includes support for the Network Connectivity metric on API Management Service in Azure.
Monitoring Support for ECS Container Insights
Opsramp now supports metrics for ECS container insights.
Log Management Enhancements
Support for Azure Log Analytics
OpsRamp now offers support for collecting logs from Azure Log Analytics workspace.
New OpenTelemetry Integration
Using the new OpenTelemetry integration you can now ingest telemetry data like metrics, logs, and traces from the already configured OpenTelemetry collector into OpsRamp.

See OpenTelemetry Integration for more details.
Tracing Enhancements
Enhancements to Logs & Tracing Solution
Trace events (if any) part of OLTP trace payloads ingested to OpsRamp can now be viewed on the Logs explorer page using query filter source “trace” and type “events”
Note: This is available only if log management is enabled for that tenant.

Network Topology Management Enhancements
Enhanced Network Topology Rendering for L2 Nodes
A significant enhancement to our network topology visualization! With this update, our system now supports rendering the topology map specifically from Layer 2 (L2) nodes. This improvement offers our customers greater flexibility and insight into L2 functionality within their network infrastructure.
Key Features:
- L2 Node Visualization: The topology map now highlights L2 nodes, enabling easy identification and analysis of their connections, relationships, and behavior.
- Granular Insights: Focusing on L2 nodes provides a deeper understanding of data flow, VLAN configurations, and spanning tree protocol operations within your network.
Benefits: - Improved Troubleshooting: Quickly identify bottlenecks, loops, or misconfigurations related to L2 nodes.
- Efficient Planning: Plan network expansions, upgrades, or migrations confidently, understanding how L2 components interact.
Service Management Enhancements
Request to rename Due Date in Service Desk
The “Due Date” field in the “Task” section has been renamed to “Task Due Date”

Patch Management Enhancements
Patch Configuration Detail API Error
We have addressed the issue of the “Get Patch Configuration Detail” API throwing a 504 error when assigned resources are large.
To resolve this, we have implemented new v3 APIs to fetch:
- Patch configuration details.
- Get resource UIDs against config job ID.
See Patch Configuration APIs for more details.
Process Automation Enhancement
Rest Web Services
Users can retrieve the necessary data via the REST web service using the process definition. This process enables you to capture data from the REST web service, with or without sub-processes.

Resource Management Enhancement
v2 Infrastructure | Action | Add Resource
You can now add resources from the UI, from Infrastructure > Search > My Resources Views.

See Infrastructure Search for more details.
Search Device by Any IP
This feature offers the ability to search for a device using multiple IP addresses it possesses, along with its basic search attributes.

See Advanced Search for more details.
Integration Framework Enhancements
Display Modified Date on Integrations and Integration Configurations
We have enhanced the integration interface to include the “Updated By” and “Updated Date” whenever any action is taken, such as modifying discovery configurations, mapping attributes, or inbound/outbound events. These columns are now visible in the listing of installed applications.

See Integrations for more details.
Add Action to Launch Activity Log of an Integration
Introduced a new feature that allows users to launch the activity logs of integrations directly from the interface.

See Audit logs for more details.
Transition of Non-DNM integrations to New UI
We are transitioning all integrations associated with the Ticketing category to a new and improved UI/UX. However, there is one exception: the “Email Requests” integration will remain unchanged.
Note: The placeholder functionality will not be accessible during the creation of Outbound events. We anticipate introducing this feature in an upcoming production update.
See Service Management for more details.
Availability Enhancement
Changes in Resource Availability Score
We have enhanced the Resource Availability score, providing users with a more granular view of the availability states of their resources.
Previously, both UNKNOWN and UNDEFINED states were considered UP, resulting in only two availability states being displayed: UP and DOWN.
With this update, users will now have visibility into each availability state of their resources, allowing them to better understand their operational status. This includes tracking the time the resource spends in UP, DOWN, UNKNOWN, and UNDEFINED states.
See Resource Availability for more details.
API Framework Enhancement
New APIs for Jobs and Scripts
New V3 APIs for automation Jobs and Scripts.
Deprecation Notices
Classic Dashboards
The classic dashboards are being deprecated, and users should now create any new dashboard requirements using Dashboards 2.0 which are feature-rich and customizable according to business needs. The default landing page is configurable to Dashboard 2.0 at the user level.
See Deprecation Notice for more details.
Patch Compliance Widget
The classic Patch Compliance Widget will be deprecated in Classic Dashboards. You will still be able to view the widgets that have already been created. After the deprecation date, you will not be able to create new instances of the Patch Compliance Widget.
See Deprecation Notice for more details.
Metrics Page
The legacy “Metrics” on resource details view will be deprecated and replaced by “Metric 2.0” which has more scalable metric data graph representation and follows industry standard metric nomenclature.
See Deprecation Notice for more details.
Standard Reports
The following reports will be deprecated in Standard Reports:
- Cloud Report
- Device Report
- Inventory Report
- Network backup report
- Login Activity Report
- Ticket Report
- Cloud Instances Report
- Monitor Details
See Deprecation Notice for more details.
Week of January 22, 2024 (2023.12-U1)
Click here to view 2023.12-U1 Release Notes
Core Platform Enhancements
Provided User-Defined protocol security (NLA/TLS) in RDP Console
When the Remote Desktop Protocol (RDP) remote console is launched, the default security protocol is configured to NLA. With this release, users now have the option to choose between the NLA or TLS security protocols.

See Launch browser consoles for RDP for more details.
Allocate Credentials to Multiple Resources
This feature allows users to assign credentials to multiple resources (up to 50 at a time) directly from the Infrastructure search resource listing page. Additionally, users have the option to assign credentials to individual resources through the resource summary slide-out.

See Assign a credential for more details.
Add Notes to Resources
This feature enables users to add notes to resources directly on the infrastructure search resource list page. Additionally, users can add notes to individual resources through the resource summary slide-out.

See Assign a note for more details.
Network Topology Management Enhancements
Resource Group-based Network Topology Visualization
A new Resource Group option has been introduced to improve the visualization of network topology. This functionality allows the rendering of resources/devices within a designated group.

Network Topology UI Enhancements
The existing Network topology has been enhanced to provide users with the ability to individually expand each node. For example, in cases where two nodes have multiple links between them, users now have the option to expand these connections as needed.
Cloud Monitoring Enhancements
Support for G2 Templates in SaaS Applications Monitoring
Implemented support for G2 templates across all Software as a Service (SaaS) applications, enabling users to seamlessly utilize G2 templates within the OpsRamp platform for various SaaS applications.
See G2 Templates Support for more details.
Alibaba, AWS, and Azure Cloud SDKs Updated to the Latest Version
The latest versions of software development kits (SDKs) have been implemented into the OpsRamp platform to discover and monitor Alibaba, AWS, and Azure Cloud. This implementation ensures that OpsRamp maintains up-to-date and effective integration with the respective cloud services.
UI Enhancements
New Interface for Creating Scheduled Maintenance
Users now have access to a new interface from the Infrastructure > Search > Home tab to create a maintenance schedule for a resource group or site.


See Manage Resource Groups and Sites for more details.
Display Logs for Device Groups and Sites
An enhanced interface is now available for users to view logs for resource groups and sites from the Infrastructure > Search > Home tab. This new interface provides an improved and user-friendly experience to access and review the logs of resource groups and sites.


See Manage Resource Groups and Sites for more details.
Personalized Dashboard landing page
Users can now set a preferred landing page and client/partner context according to their profile settings. For example, a user can designate Dashboard 2.0 as their default landing page.

See My Profile for more details.
Traces Enhancements
New metrics support in Tracing Proxy
The tracing proxy has been updated with the introduction of new metrics, including:
- trace_apdex_latency: This metric establishes buckets according to the configured apdex threshold for latency in milliseconds. As traces are ingested, they categorize into these buckets based on their latency values, subsequently increasing the counter associated with each bucket. The counter for a specific bucket can be accessed through the auto-generated metric trace_apdex_latency_bucket{le="< latency>"}.
- trace_response_http_status: Indicates the total count of requests based on HTTP status codes.
- trace_response_grpc_status: Represents the total count of requests based on GRPC status codes.
Trace Details page enhancements
The trace details page has been enhanced to display service level latency for the specific trace, accompanied by a visual representation in the form of a pie chart.

Dashboard 2.0 Enhancements
Geomap for Dashboard 2.0
The Geomap visualization feature enables users to quickly analyze and comprehend location-specific data with a simple glance. Users can now incorporate a Geomap into Dashboard 2.0, enabling them to visually depict alerts or resources based on site location.
Note: The Geomap functionality is only available for Resource Tile and Alert Tile.

See Alert Tile and Resource Tile for more details.
Advanced Filtering Capabilities for all Variable Types
The dashboard variable’s usability has been enhanced to function as universal attributes applicable to all tiles. Enhanced performance is noticeable as tiles that leverage the specified variable will automatically refresh when there are updates to the values.

See Variable Filters for more details.
Integration Framework enhancements
Updated Credential Set details reflect in the linked SDK apps
Modifying the credential set will trigger automatic updates for the linked SDK apps associated with that specific credential set.
Event Management Enhancements
Generate Forecast Alerts in Alert Definitions using PromQL
Users can configure forecasts directly from Alert Definitions. This allows them to overcome existing limitations present in template-based forecasts, such as constraints on the number of devices and metrics.

See Alert Definitions for more details.
Reports/Reporting Apps Enhancements
Introducing Gateway Details Application in Reporting apps
The new application offers in-depth information about your managed Gateways, encompassing essential gateway details and capacity metrics. This includes the number of managed devices, metrics collected, and utilization statistics for CPU, memory, and disk.
See Gateway Details for more details.
Introducing Role-Based Access Control (RBAC) Support in Reporting apps
The RBAC functionality has been integrated into the following reporting apps:
- Metric Insights
- Network Utilization
The generation of report data will be as per the user roles and permissions.
See Permissions for more details.
Provided option to share the analysis in Reporting apps
The Sharing Analysis feature is now available in Reporting Apps, offering the following functionalities:
- Users can now share their analysis with others based on their roles within the same scope.
- Analysis configurations are automatically shared with default administrators by default.
See Share the Analysis for more details.
Process Automation Enhancements
Enabling Resource Custom Attributes in Process Definitions
A new token support has been introduced in the resource entity for tags, that allows iteration over resource tags and enables filtering based on both tag names and values.
See Process Automation Variables for more details.
Service Management Enhancements
Automated Escalated Priority for Tickets Created by Designated Users
Users can now set the default priority to ‘urgent’ for specific individuals, identified as important users, via the service desk settings found in the Setup > Service Desk settings.
As a result, if a user from the designated user group creates a new ticket either from their login or by specifying the user in the “requestedBy” field—whether done manually or through the Ticket Create API with the “requestedBy” property in the request payload—the default priority will be automatically set to urgent.
See Service Desk for more details.
Deprecation Notices
The Containers page will be deprecated by July 2024. As an alternative, we encourage users to use Dashboard 2.0 or the new resources page to view their containers or view metrics for any specific set of containers.See Deprecation Notices for more details on alternative solutions or a roadmap. Please reach out to OpsRamp support for any further queries.